SX-IO — Internal Data Points
Overview
Section titled “Overview”In addition to external device polling, SX-IO can expose the SMX-RNS20’s own internal metrics as data points. These can be displayed on the cloud dashboard, published via MQTT, or used to trigger alerts — without needing to connect to any external PLC or sensor.
Available Internal Data Points
Section titled “Available Internal Data Points”| Data Point | Unit |
|---|---|
| WAN Signal Level | dBm (cellular) / % (WiFi) |
| WAN Signal Quality | % |
| CPU Temperature | °C |
| CPU Usage | % |
| Memory Usage | % |
| System Uptime | seconds |
| WAN IP Address | string |
| Active Connections | count |
| Data Sent (WAN) | bytes |
| Data Received (WAN) | bytes |
Configuration
Section titled “Configuration”- Log in to the SMX-RNS20 web interface → SX-IO → Sources → Add Source → Internal.
- Select the internal data points you want to enable.
- Set the update interval (e.g., 60 seconds for signal level, 5 seconds for active connections).
- Under SX-IO → Outputs, add a Dashboard widget or MQTT topic for each internal metric.
- Save. The data points appear in the Monitor view and can trigger alarm rules like any other SX-IO source.
Screenshots — INTERNAL Driver Setup
Section titled “Screenshots — INTERNAL Driver Setup” Step 1 — Modules → Driver
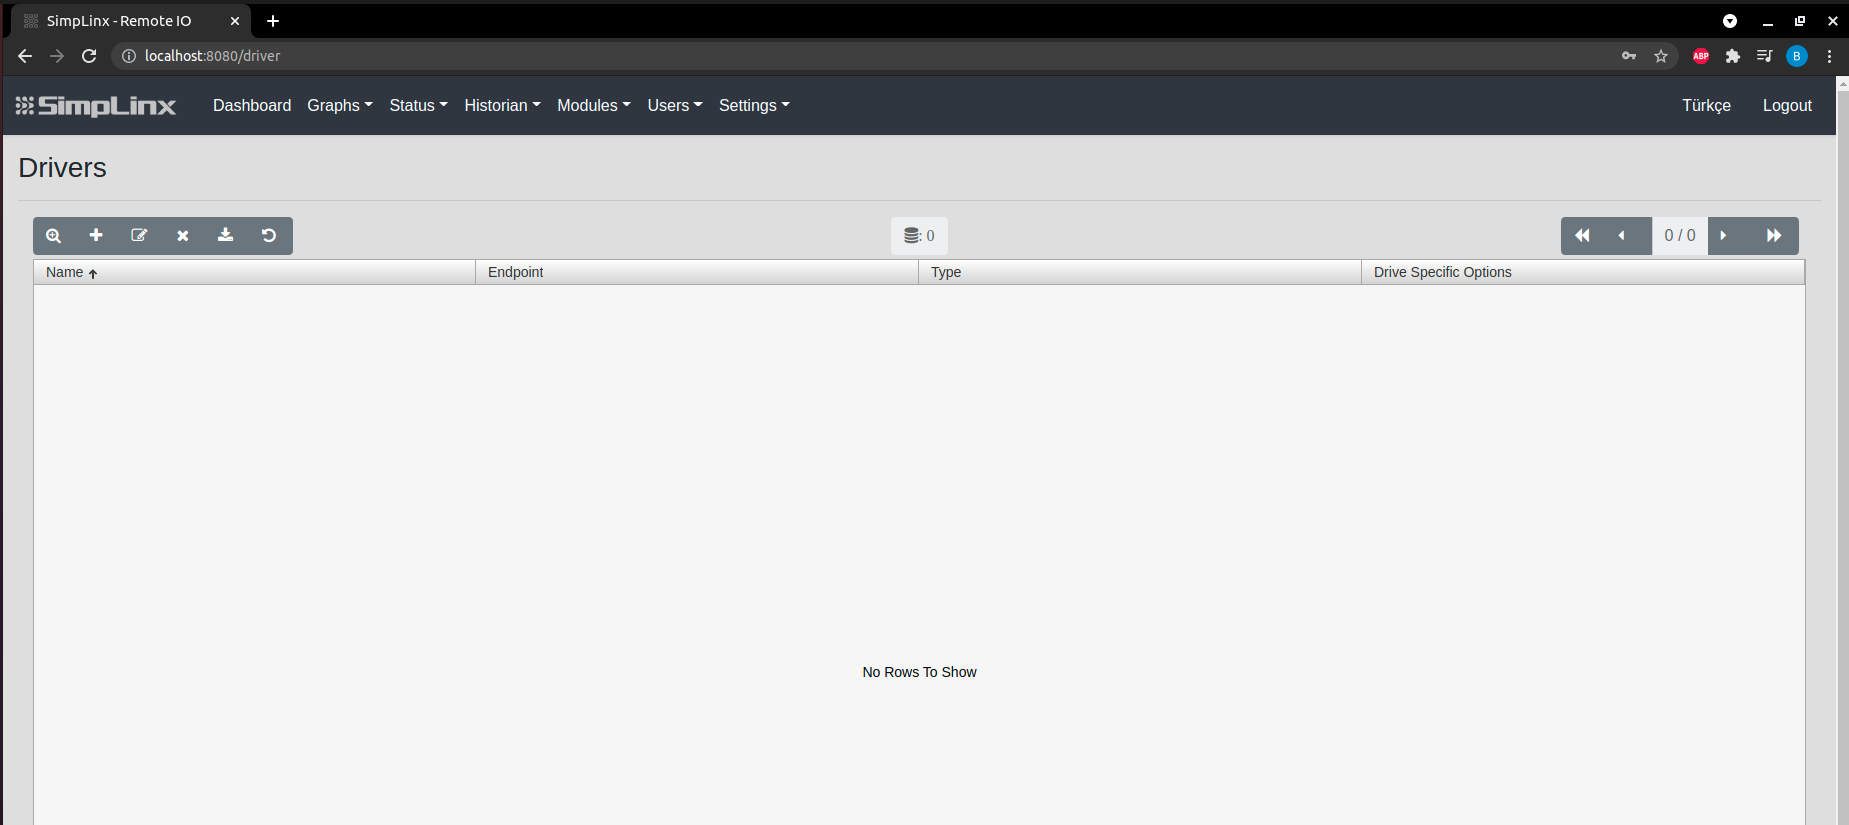 Step 2 — Add new driver
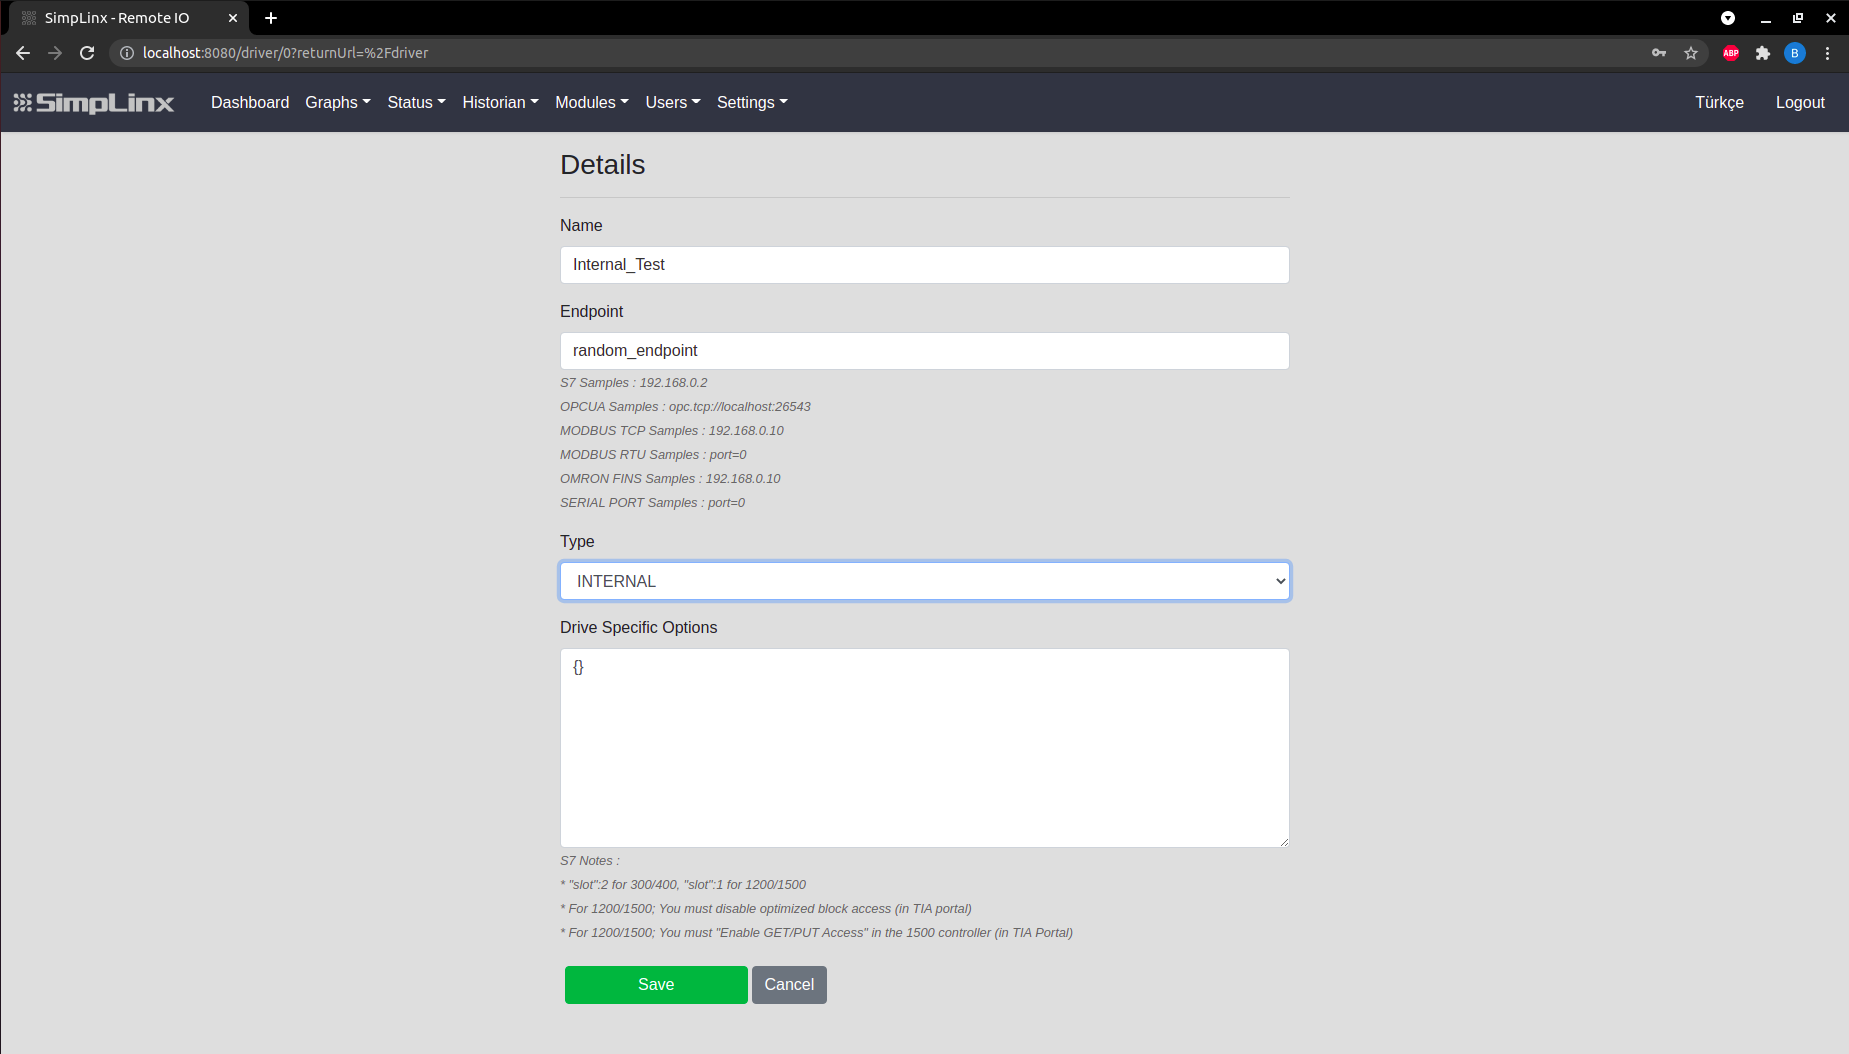 Step 3 — Driver settings: Name, Endpoint (any), Type = INTERNAL
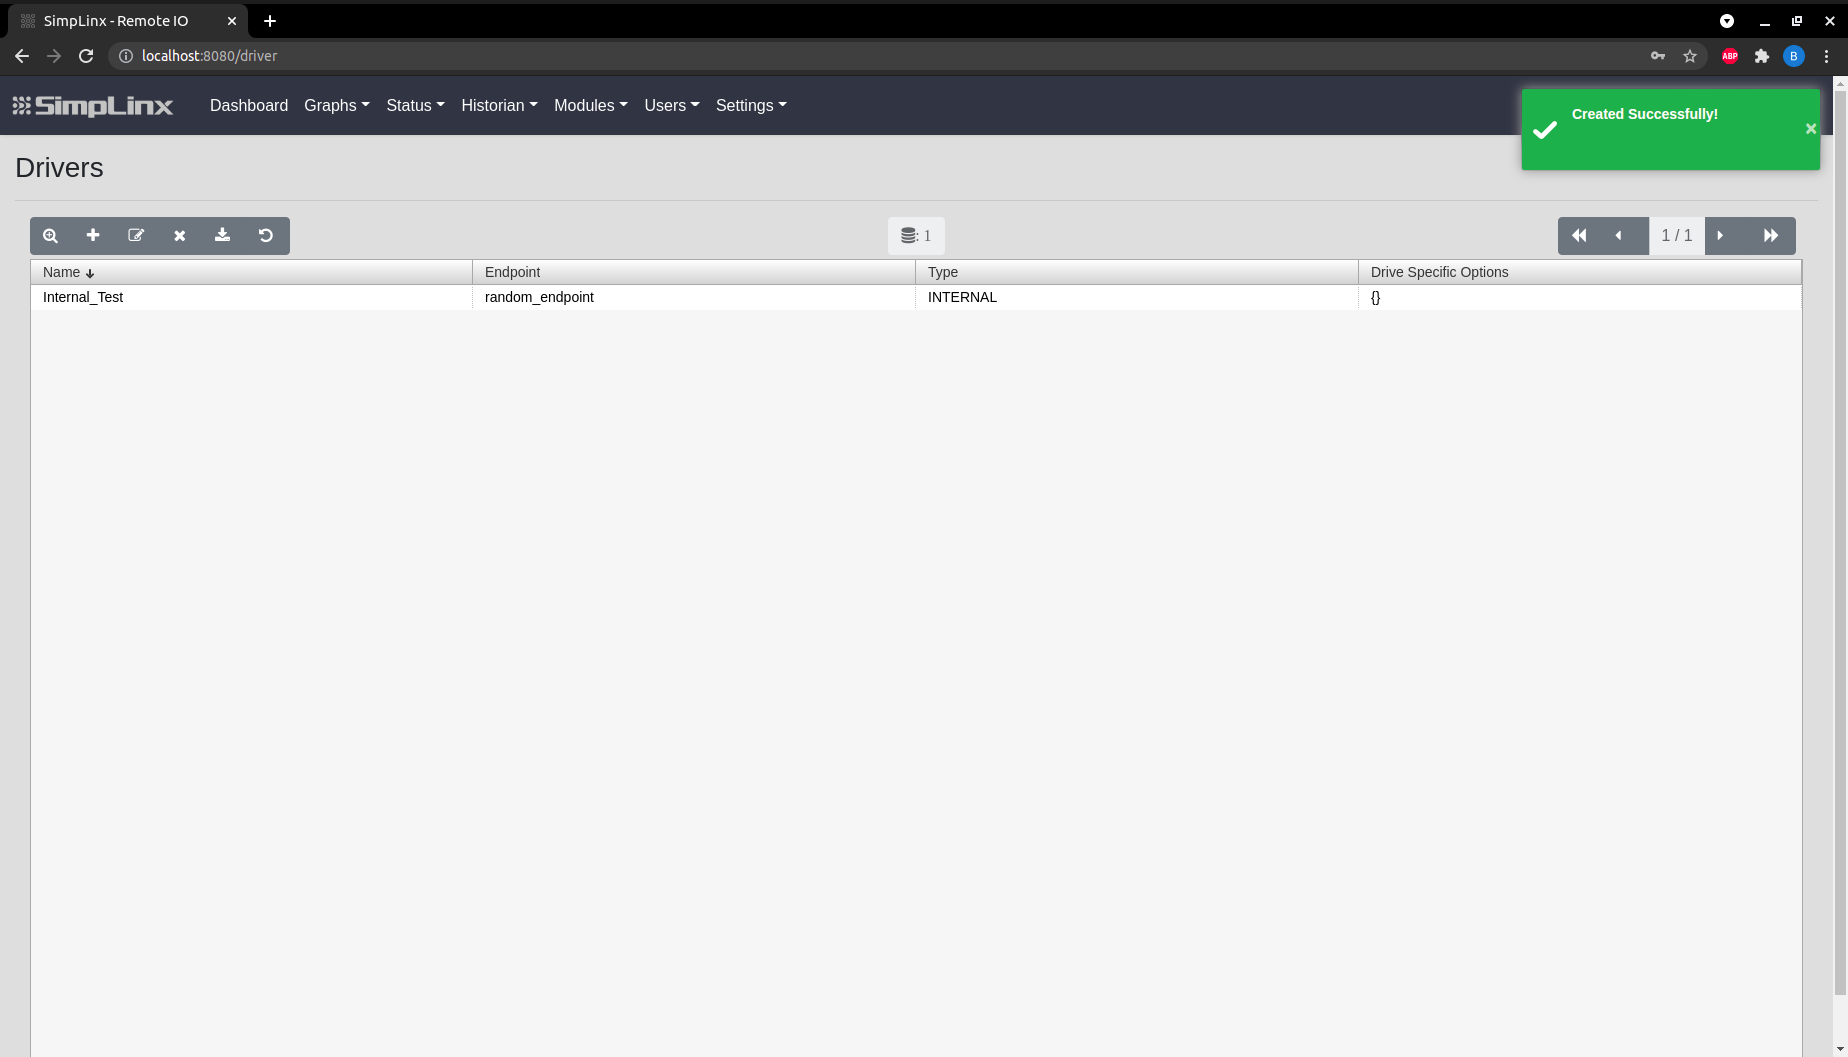 Step 4 — Save driver
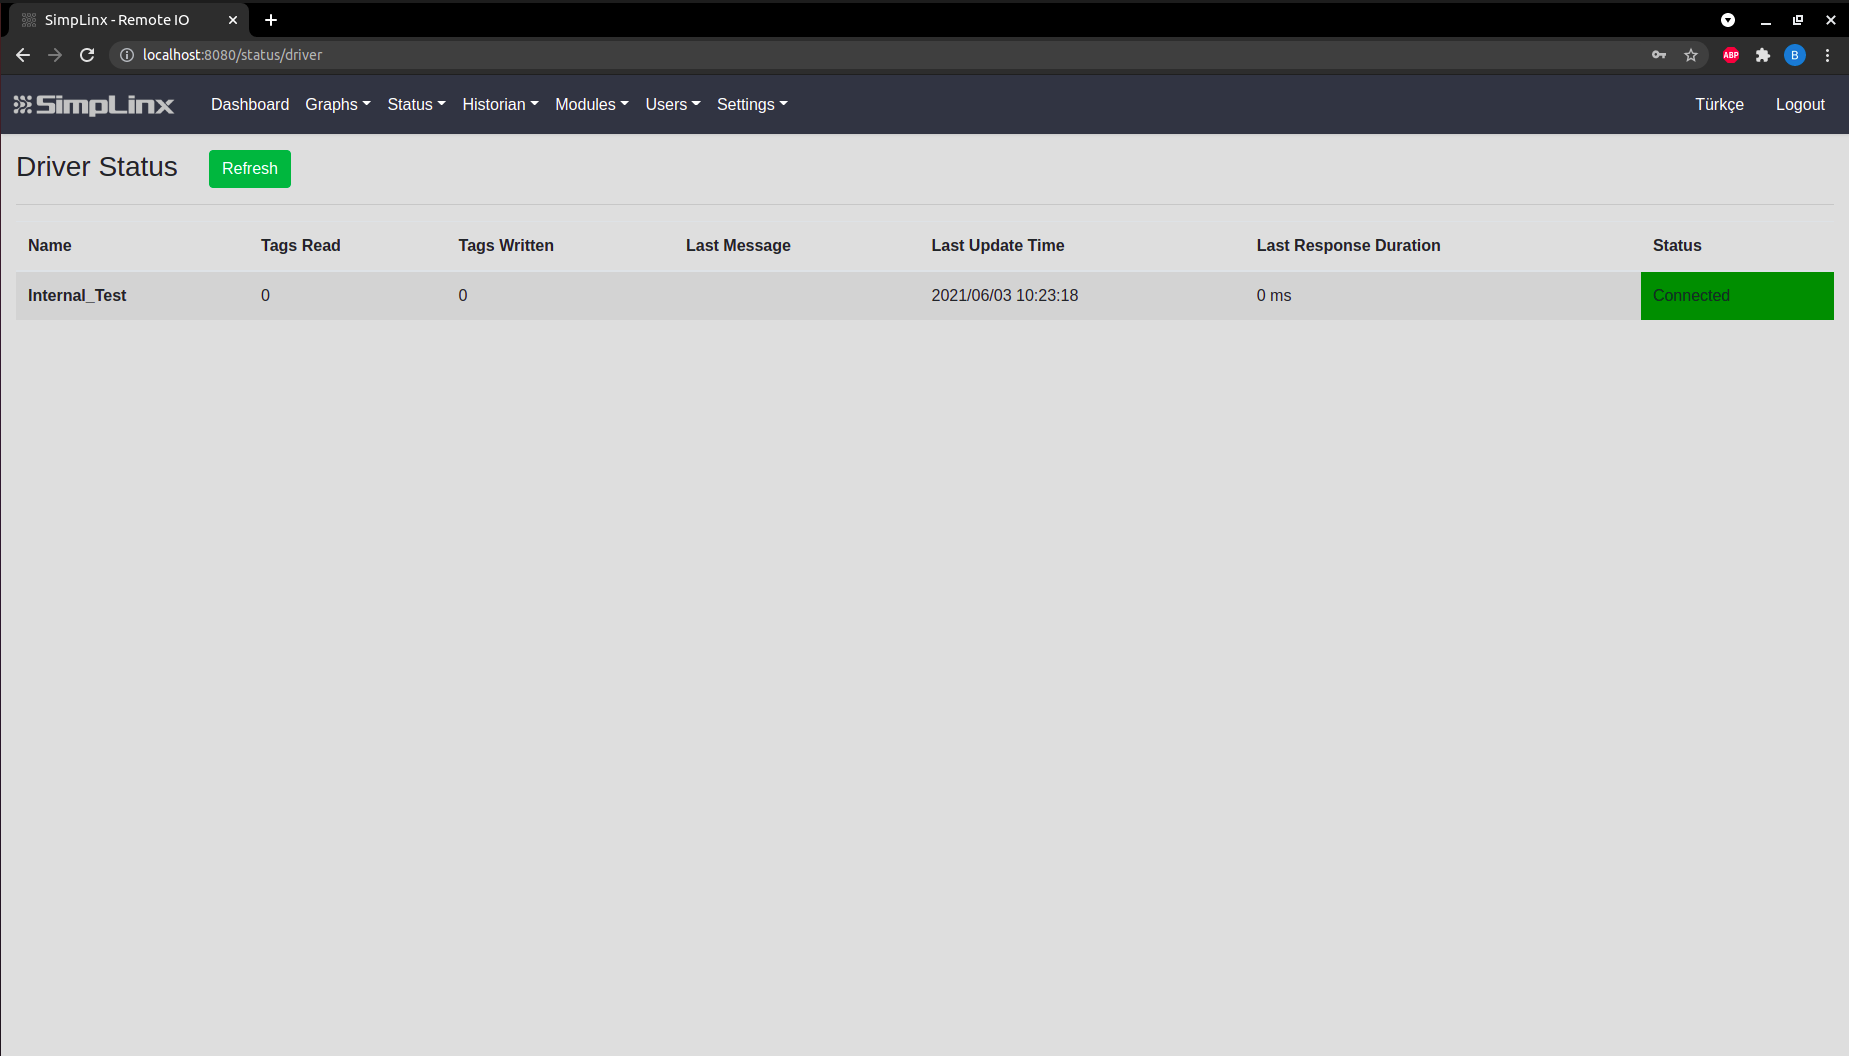 Step 5 — Status → Driver: INTERNAL driver shows green connected
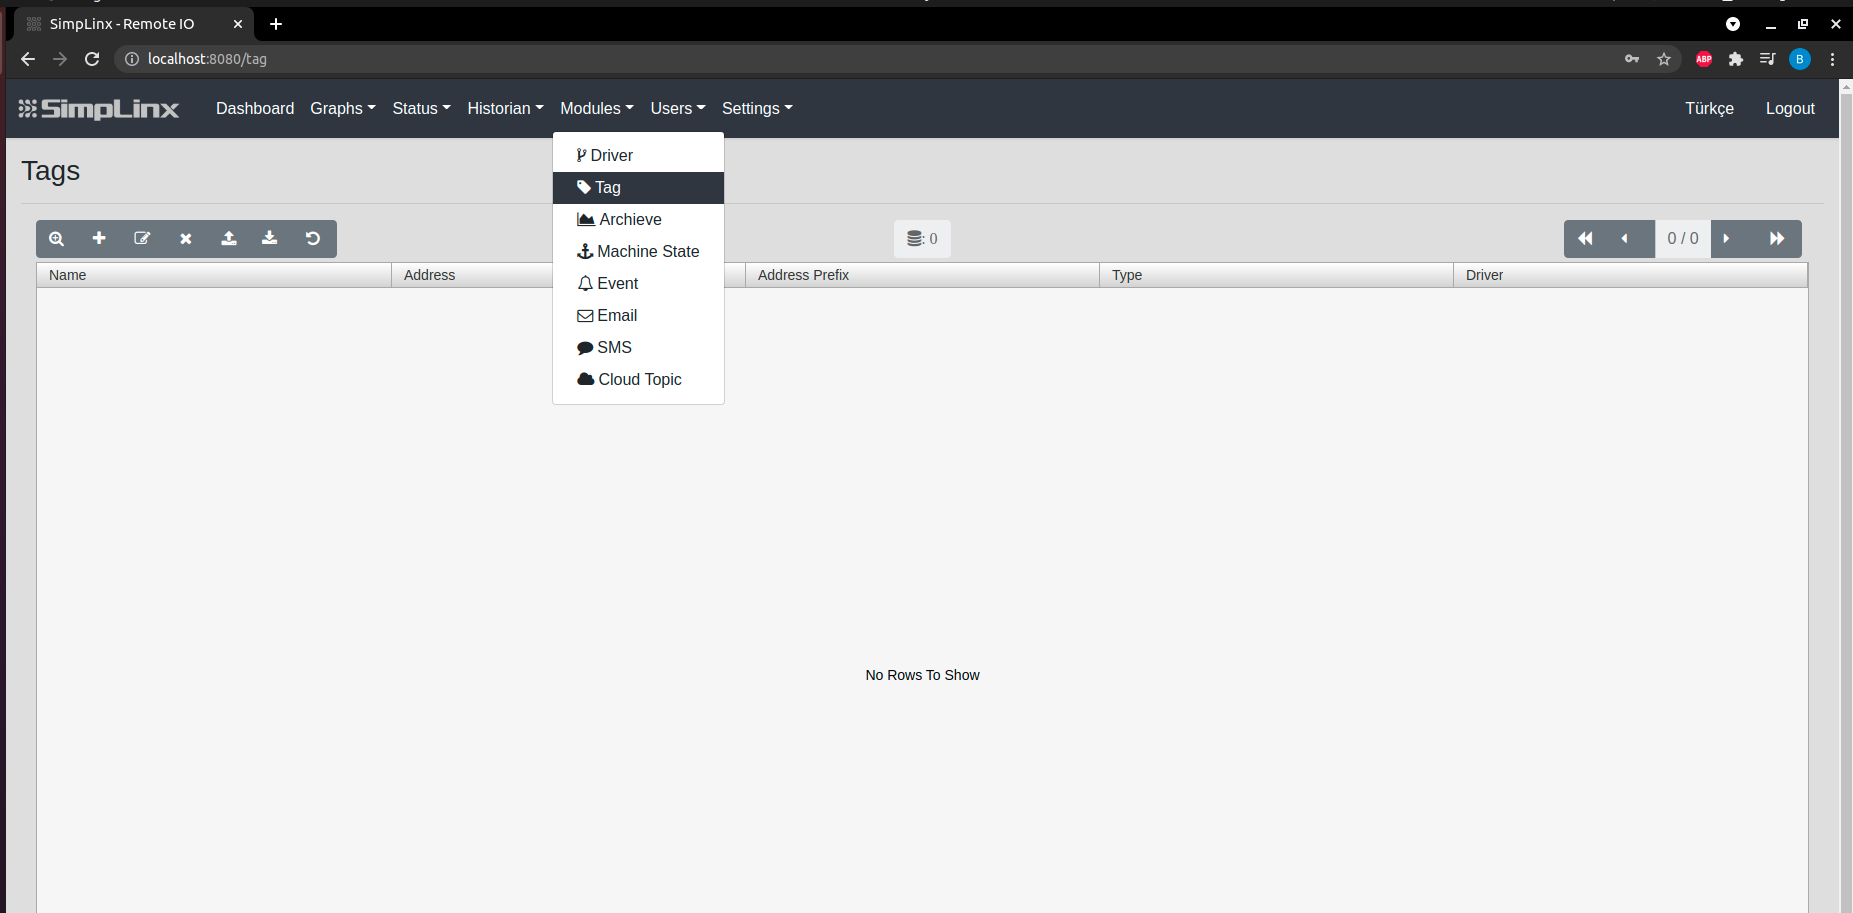 Step 6 — Modules → Tag
 Step 7 — Tag configuration: Name, Type, Address (internal metric name), Driver
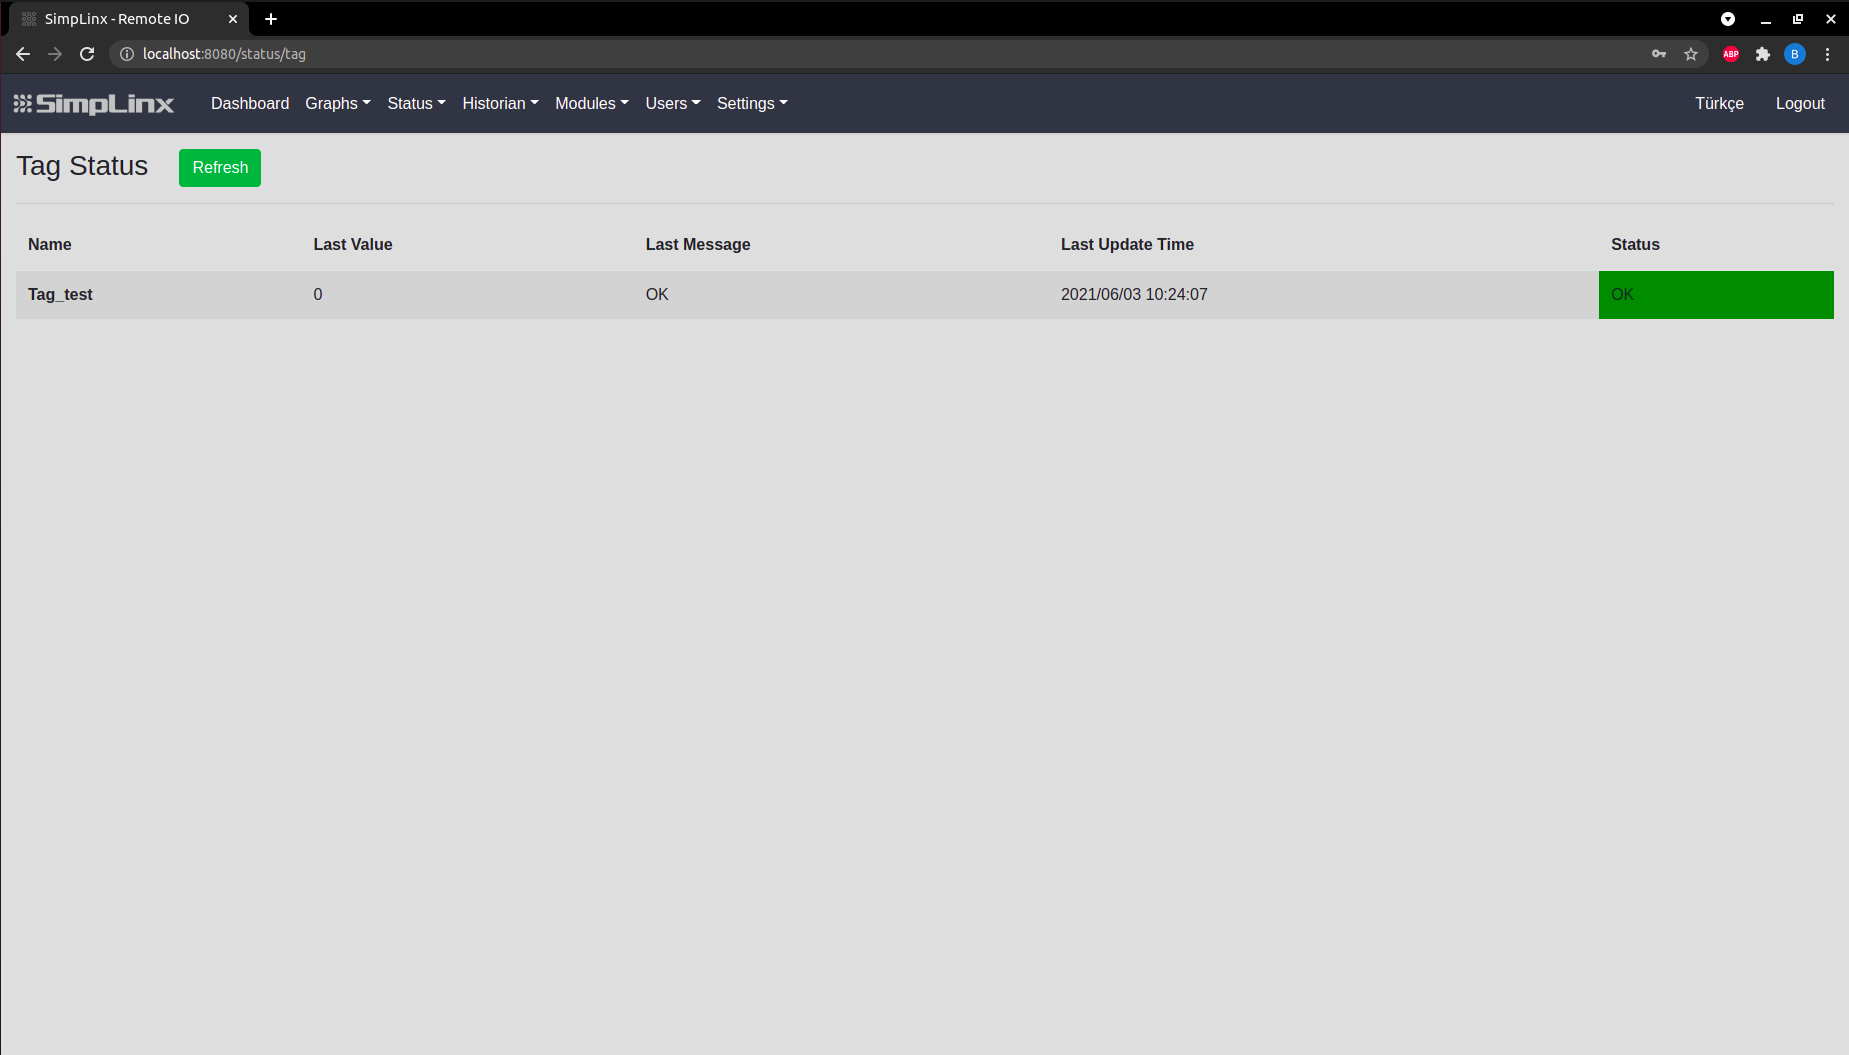 Step 8 — Status → Tag: live internal metric value (e.g., signal level, CPU temperature)