
SX-IO User Guide
Preface
Section titled “Preface”Purpose of the Document
Section titled “Purpose of the Document”This document contains information about the following topics;
- SX-IO Usage
Required Level of Knowledge
Section titled “Required Level of Knowledge”In order to fully understand and apply this document, it is necessary to have knowledge of IT, Automation and Electricity.
Home Page
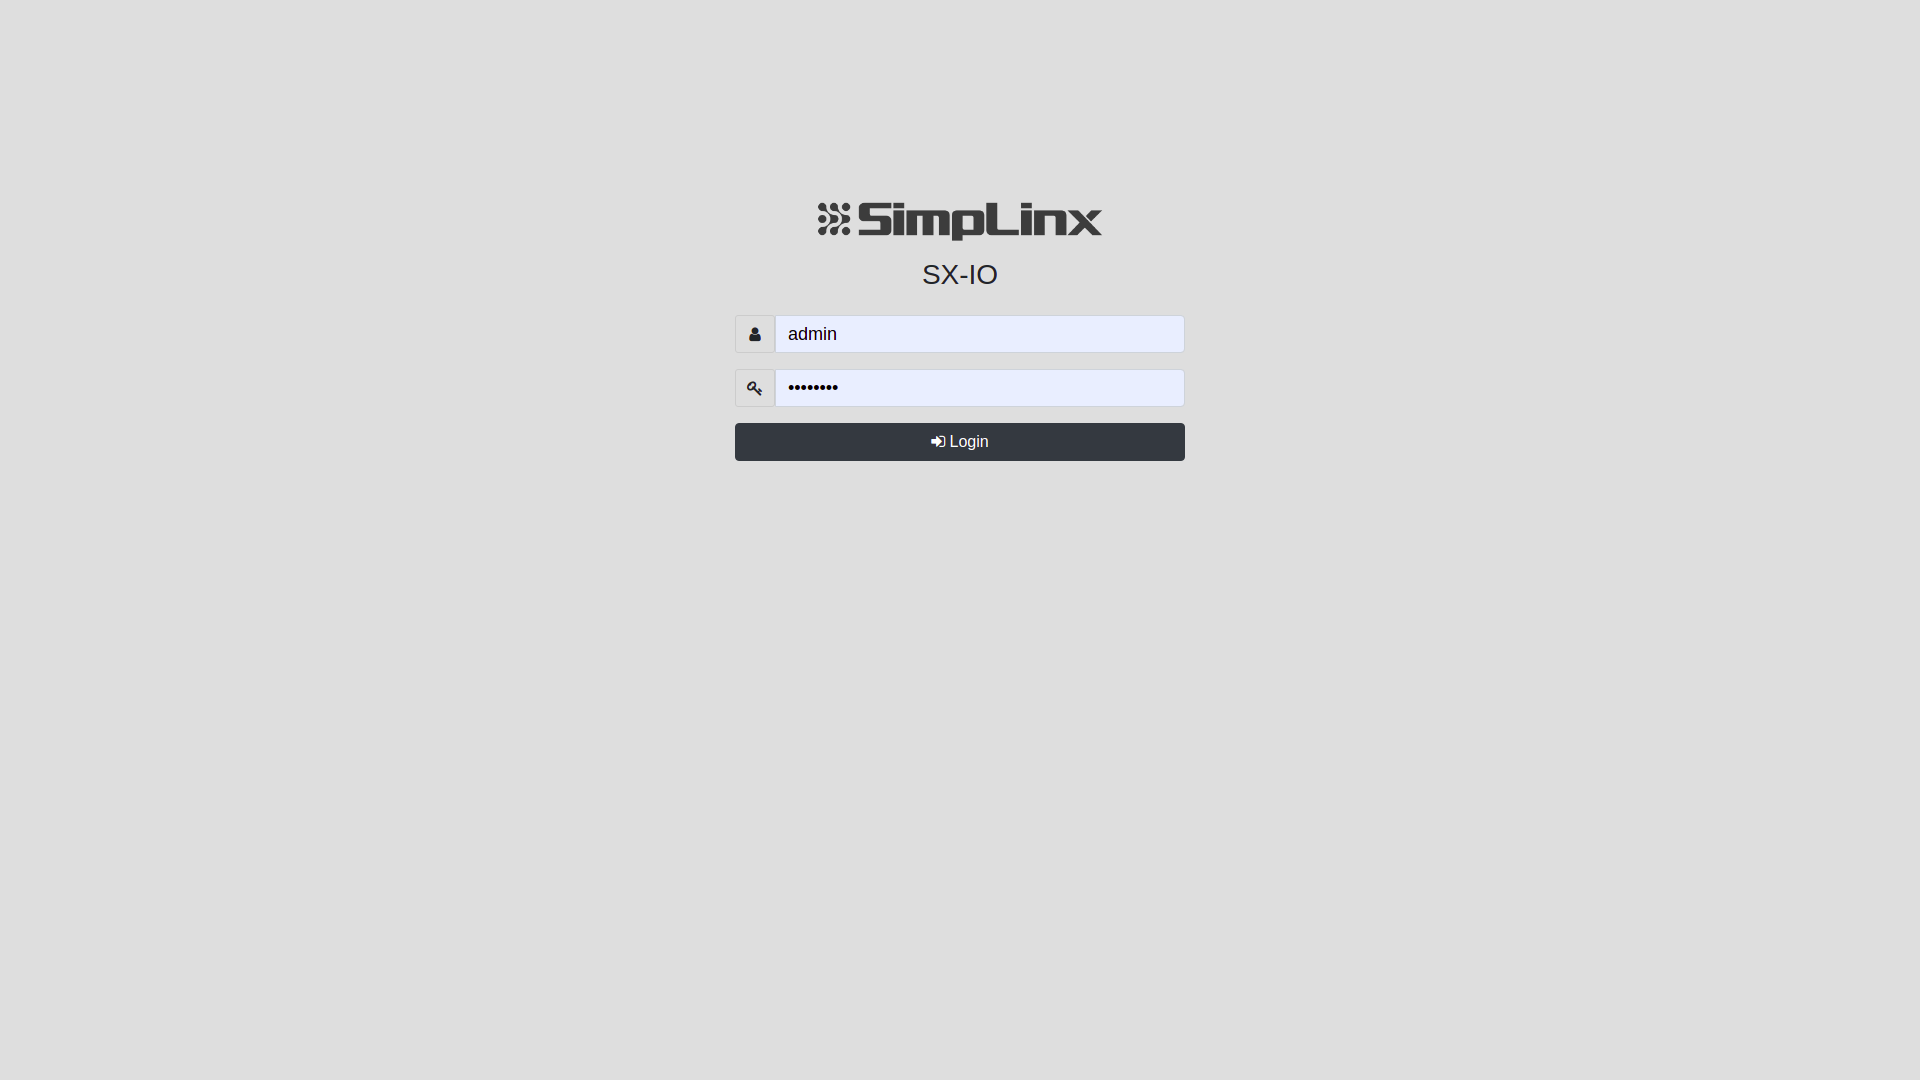
Section titled “Home Page”There ise one built-in user : “admin” to log into the SX-IO interface.
Admin User
Section titled “Admin User”The Admin user is the main account. It has all the privileges including system settings and creating new users.
Dashboard Manager
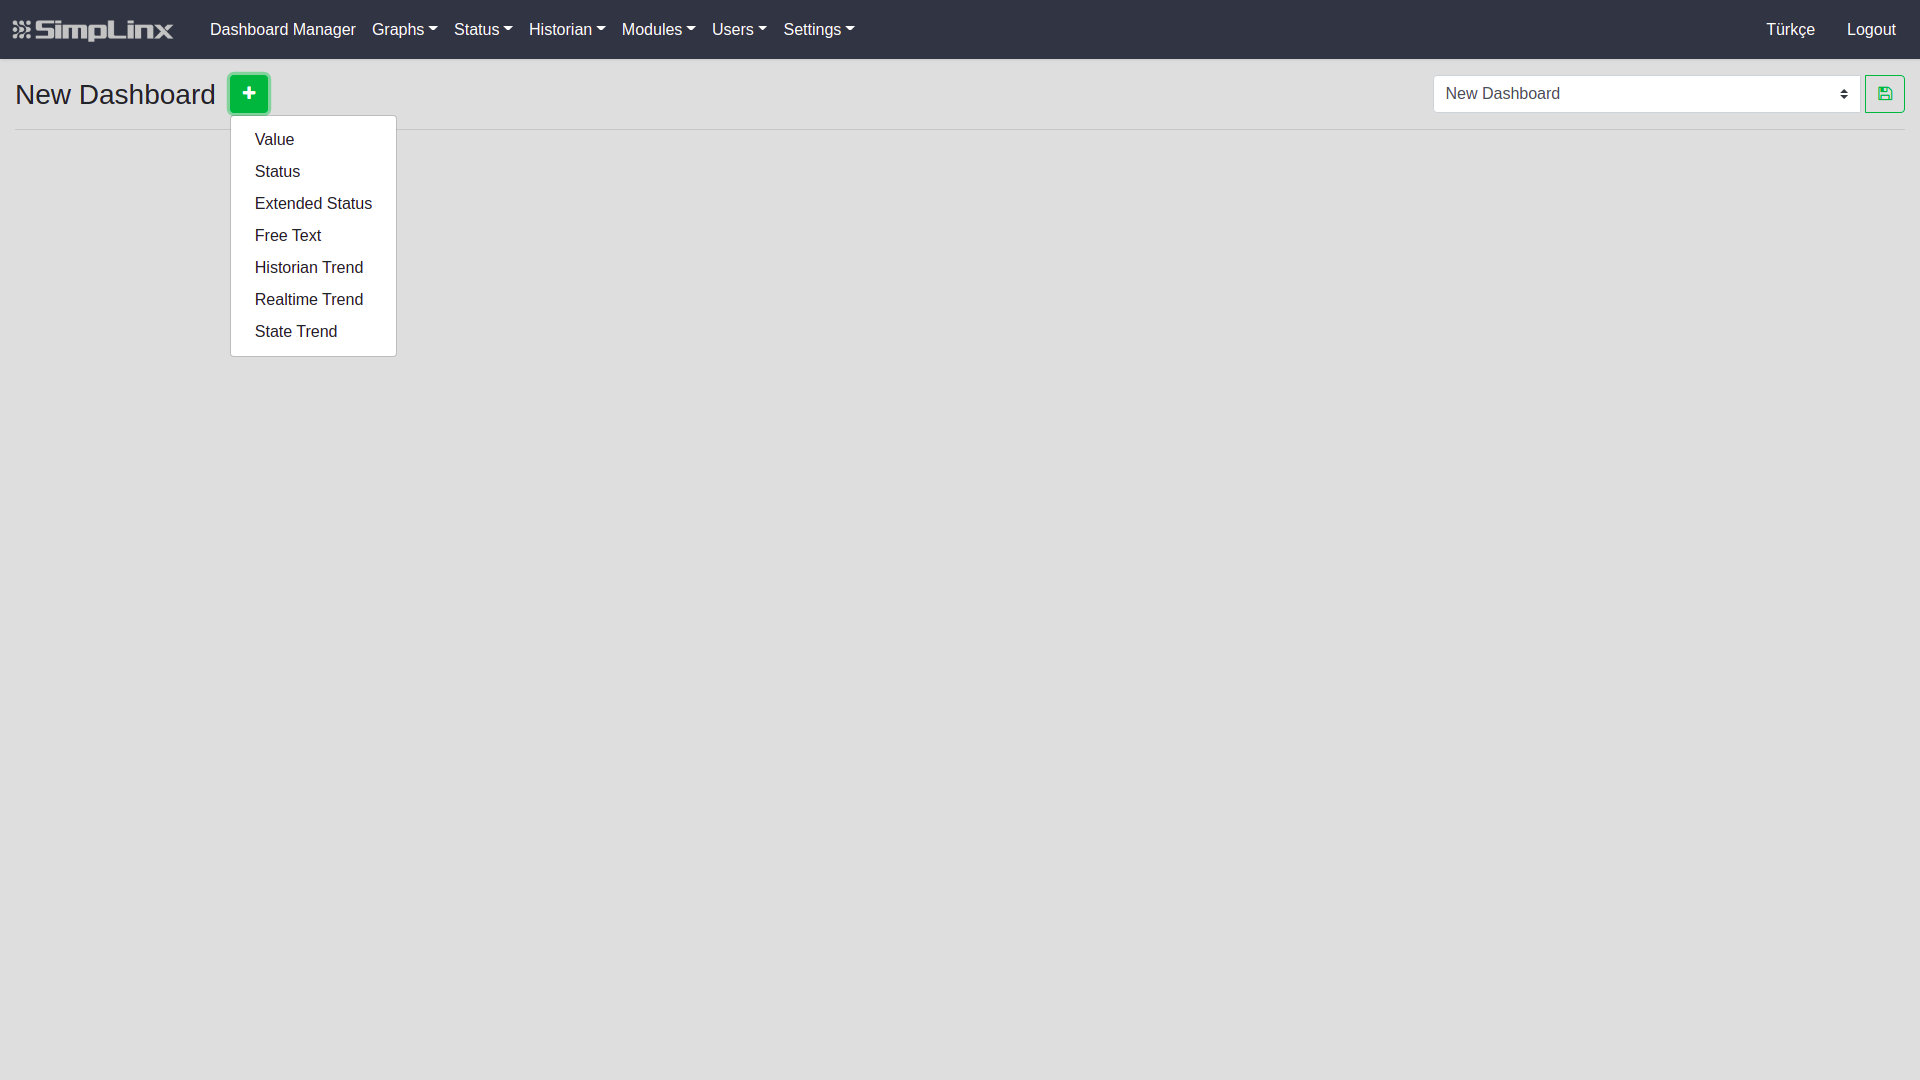
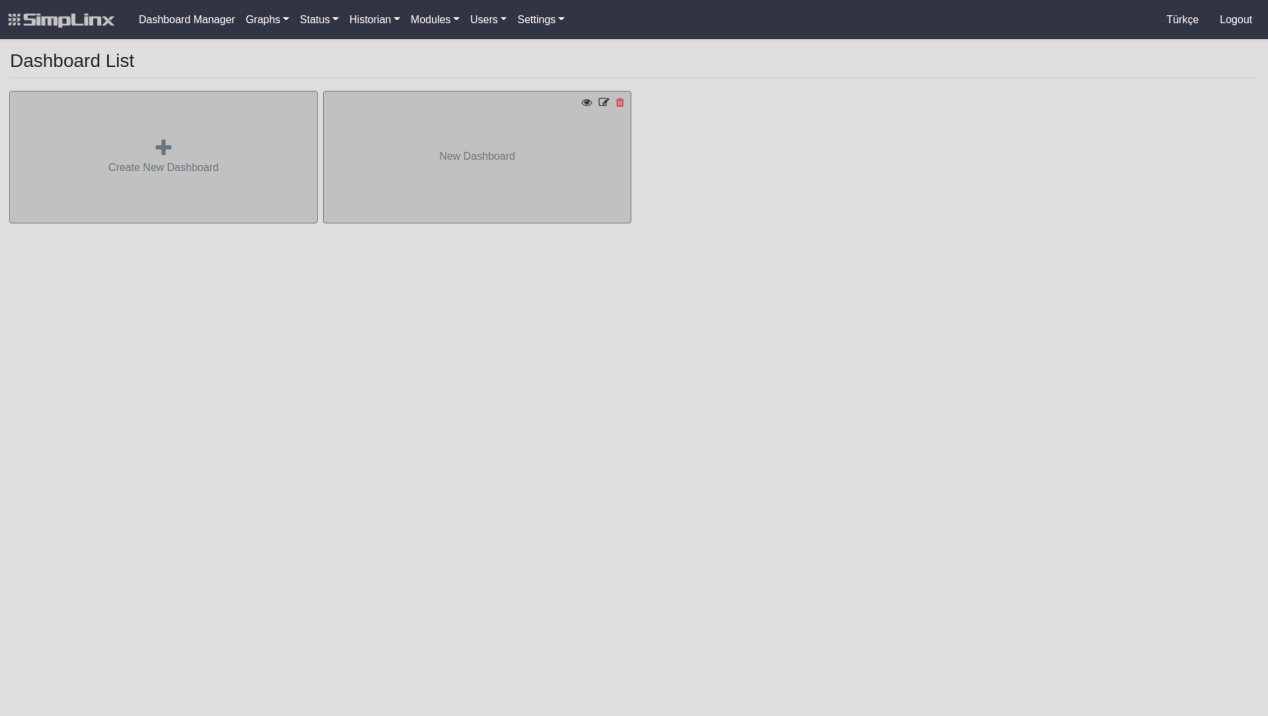
Section titled “Dashboard Manager”You can create dashboards for specific requirements and for each dashboard you can create graphics for the “Tags” you have added to the system on the dashboard. You can add new dashboards to the system on “Dashboard” page. Click “+ Create New Dashboard” button and new dashboard will appear. You can give a name your dashboard. After that click your new dashboard, the “+” button located next to the your new dashboard name label text on the upper left of the page.
-
Value
-
Status
-
Extended Status
-
Free Text
-
Historian Trend
-
Realtime Trend
-
State Trend
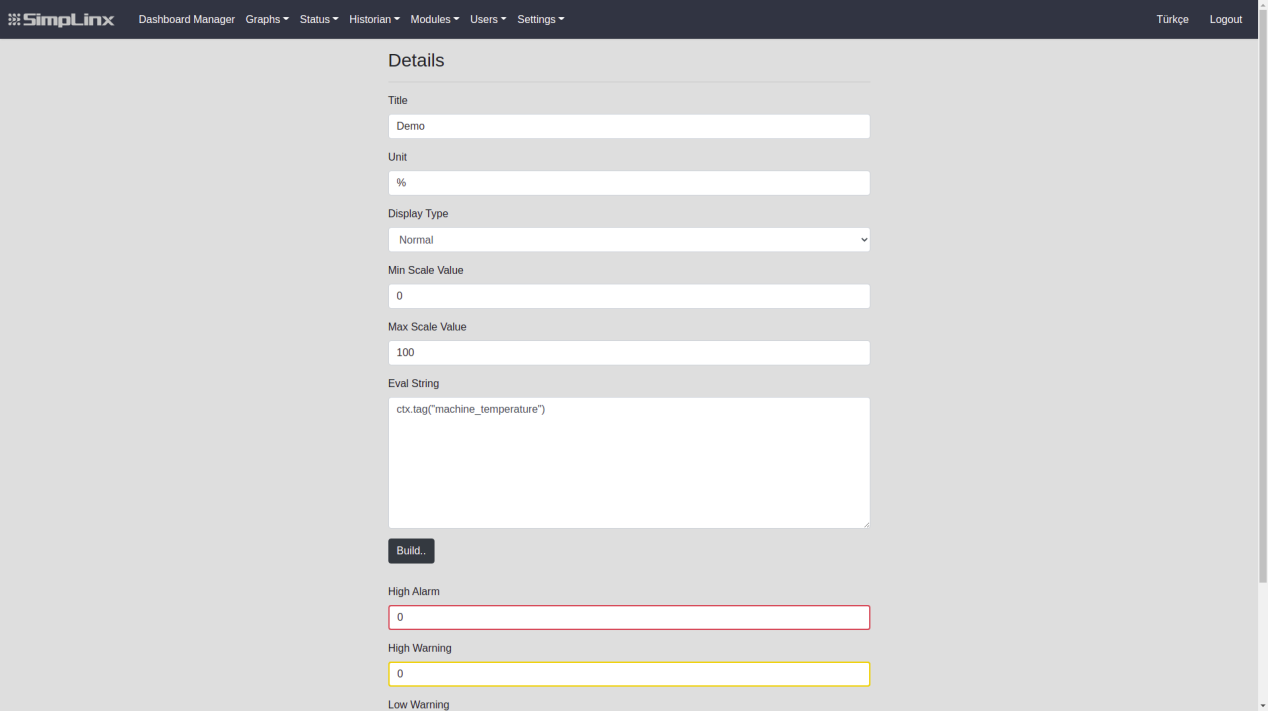
On the page that opens when you select the “Value” chart;
-
Enter your chart title in the “Title” box.
-
Enter the unit of your chart in the “Unit” box. (example ”%”,“seconds”)
-
Enter the lower limit of the graph to the “Lower Limit of Value” box.
-
Enter the upper limit of the graph to the “Upper Limit of Value” box.
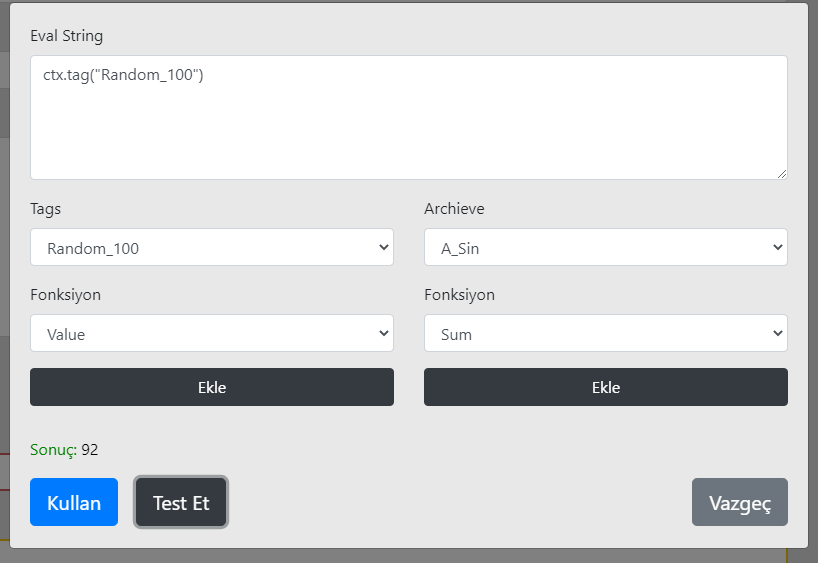
Click the “Create” button under the “Eval String” box. In the window that opens, there are “Tags” that you have added in the list named “Tags”. You can choose the one you want to see in the chart from this list and you can determine the display type of the “Tag” you have selected from the “Function” box. The “Value” option under “Function” shows the value of the “Tag”, and the “Bit” option shows its address.
After making the selection, you can add it with the “Add” button and check whether it works correctly with the “Test” button. If your settings are correct, you can confirm the changes with the “Use” button.
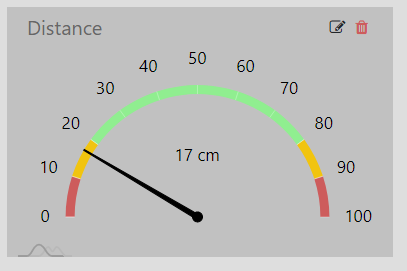
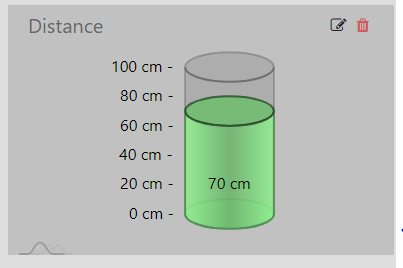
There are 5 different graphic options under “View Type”.
|
|
|||
|---|---|---|---|---|
|
 |
|||
 |
||||
Status
Section titled “Status”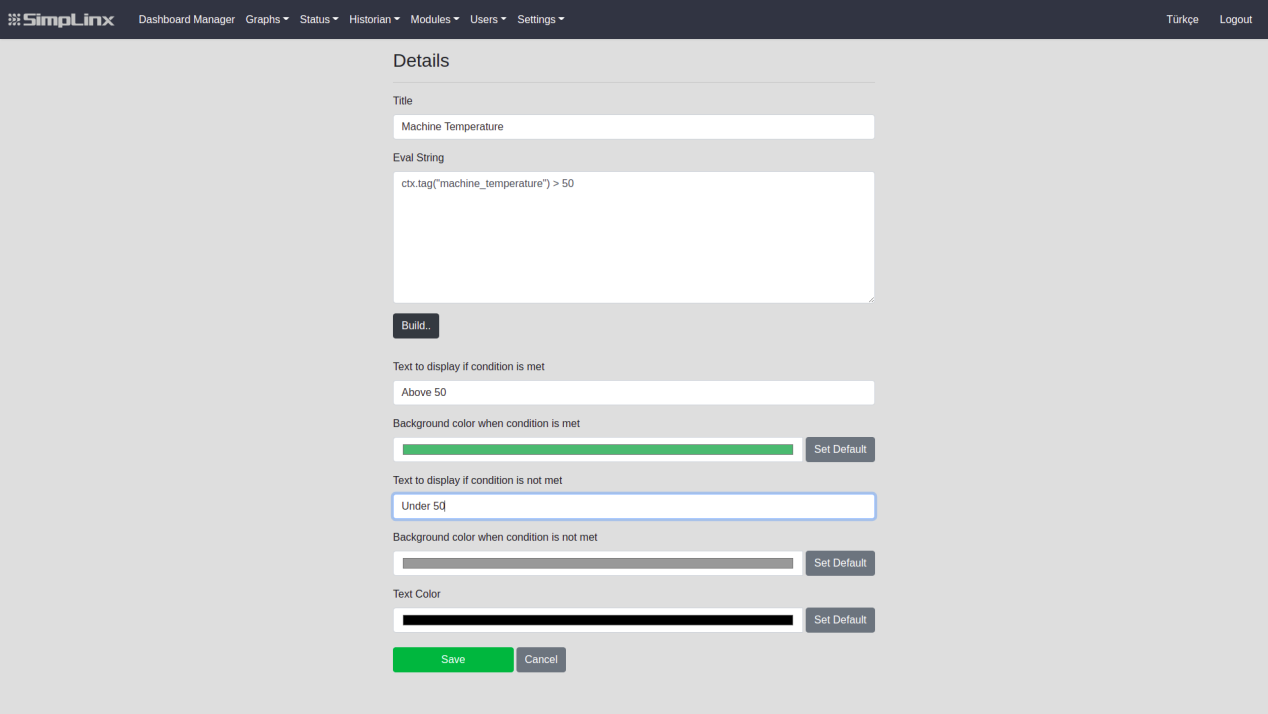
• After clicking “Status”, “Details” page will be appear. On this page,
-
Title: Type your Status title in the “Title” box.
-
Eval String: This box for building a condition for status.
-
Text to display if condition is met: This text will appear if Eval String condition is true
-
Background Color when condition is met: You can select color for displaying condition is satisfied.
-
Text to display if condition is not met: This text will appear if Eval String condition is false
-
Background color when condition is not met: You can select color for displaying condition is not satisfied.
-
Text Color: You can select text color.
Extended Status
Section titled “Extended Status”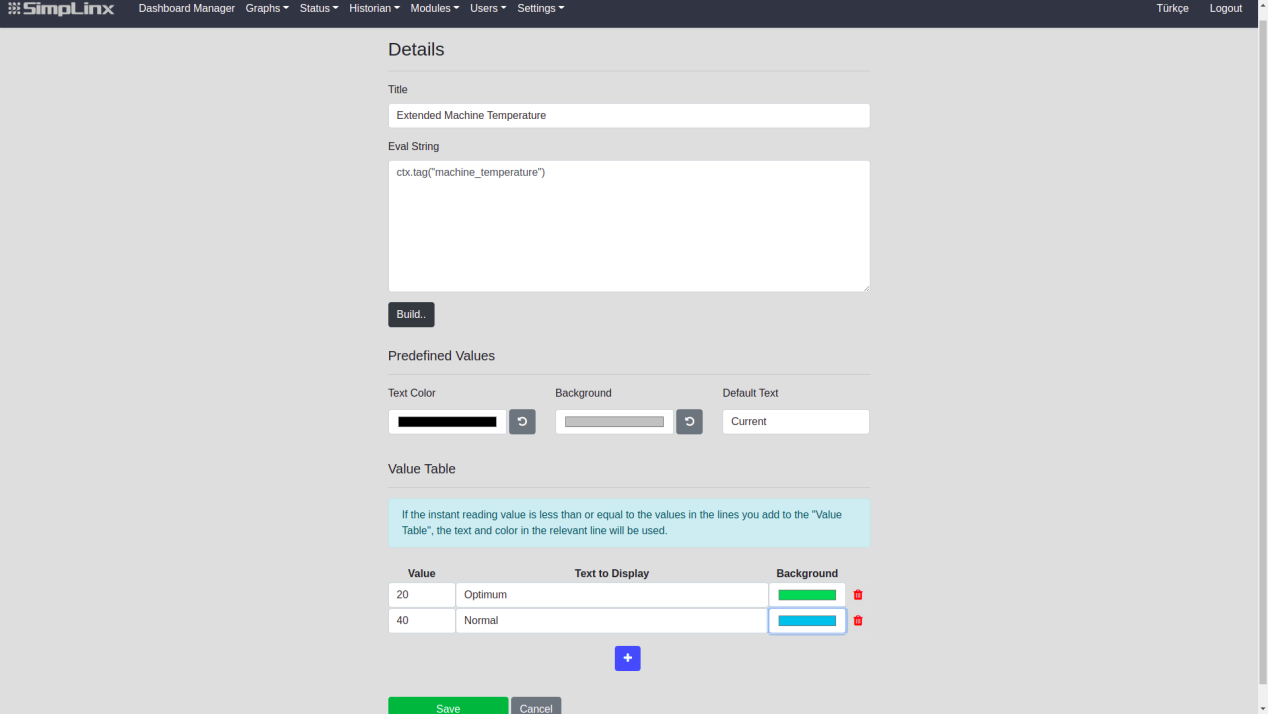
After clicking “Extended Status”, “Details” page will be appear. On this page,
-
Title: Type your Extended Status title in the “Title” box.
-
Eval String: This box for building for value.
-
Predefined Values: You can choose background color, default text and text color for predefined values.
-
Value Table: If the instant reading value is less than or equal to the values in the lines you add to the “Value Table”, the text and color in the relevant line will be used.
-
Value: Choose value for this condition.
-
Text to Display: Write text for to display for this specific value.
-
Background: Select color for this specific value.
Free Text
Section titled “Free Text”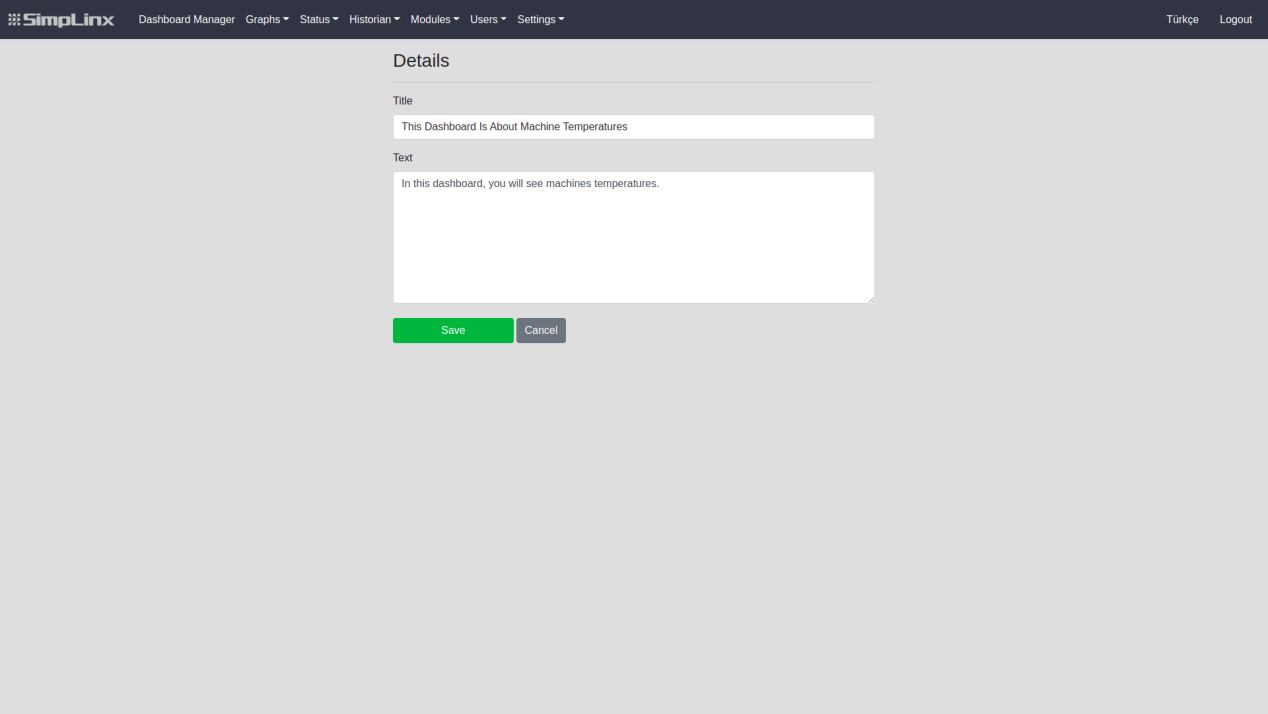 • After clicking “Free Text”, “Details” page will be appear. On this page,
-
Title: Type your Free Text title in the “Title” box.
-
Text: Write your description for this title.
Historian Trend
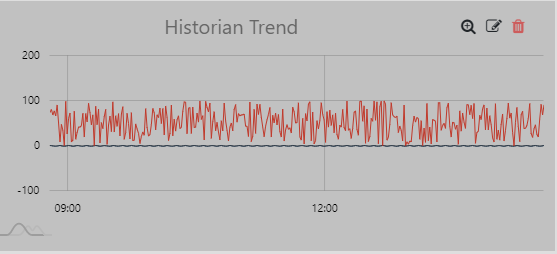
Section titled “Historian Trend”You can view the archive data of the “Tag” you have selected in the “Historian Trend” graphic option.
On the page that opens when you select the “Historian Trend” graphic;
-
Type your graphic title in the “Title” box
-
Enter the period option as “Daily”, “Weekly” or “Monthly” with the “Time Interval” option
-
Select “Tag” that you want to view with the “Archive” option and add it with the ”+” button side
Then you can create your graphic with the “Save” button.
Realtime Trend
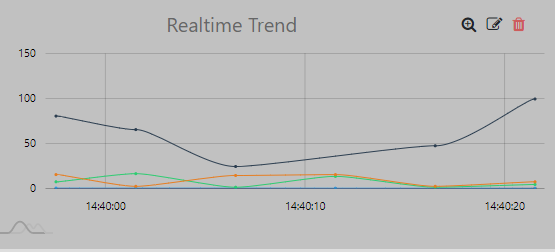
Section titled “Realtime Trend”You can view the real-time data of the “Tag” you have selected in the “Real-time Trend” graph option.
On the page that opens when you select the “Real-time Trend“ graph;
-
Type your graphic title in the “Title” box
-
Select “Tag” that you want to view with the “Tag” option and add it with the ”+” button side
Then you can create your chart with the “Save” button.
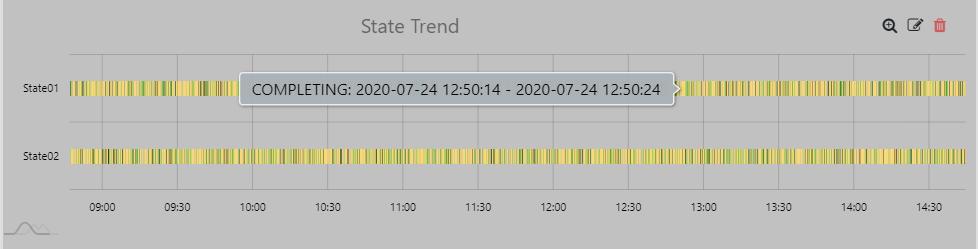
State Trend
Section titled “State Trend”You can view the machine state data of the “Machine State” you have selected in the “State Trend” graph option.
On the page that opens when you select the “State Trend“ graph;
-
Type your graphic title in the “Title” box
-
Enter the period option as “Daily”, “Weekly” with the “Time Interval” option
-
Select “State” that you want to display with the “Machine State” option and add it with click.
Then you can create your chart with the “Save” button.
In the upper right corner of the graphics you add;
-
You can delete the graphic with the “Trash” icon.
-
You can edit graphic information with the “Edit” icon
-
You can view your chart on “State Center” page with the “Magnifier” icon
Historian Chart Center Page
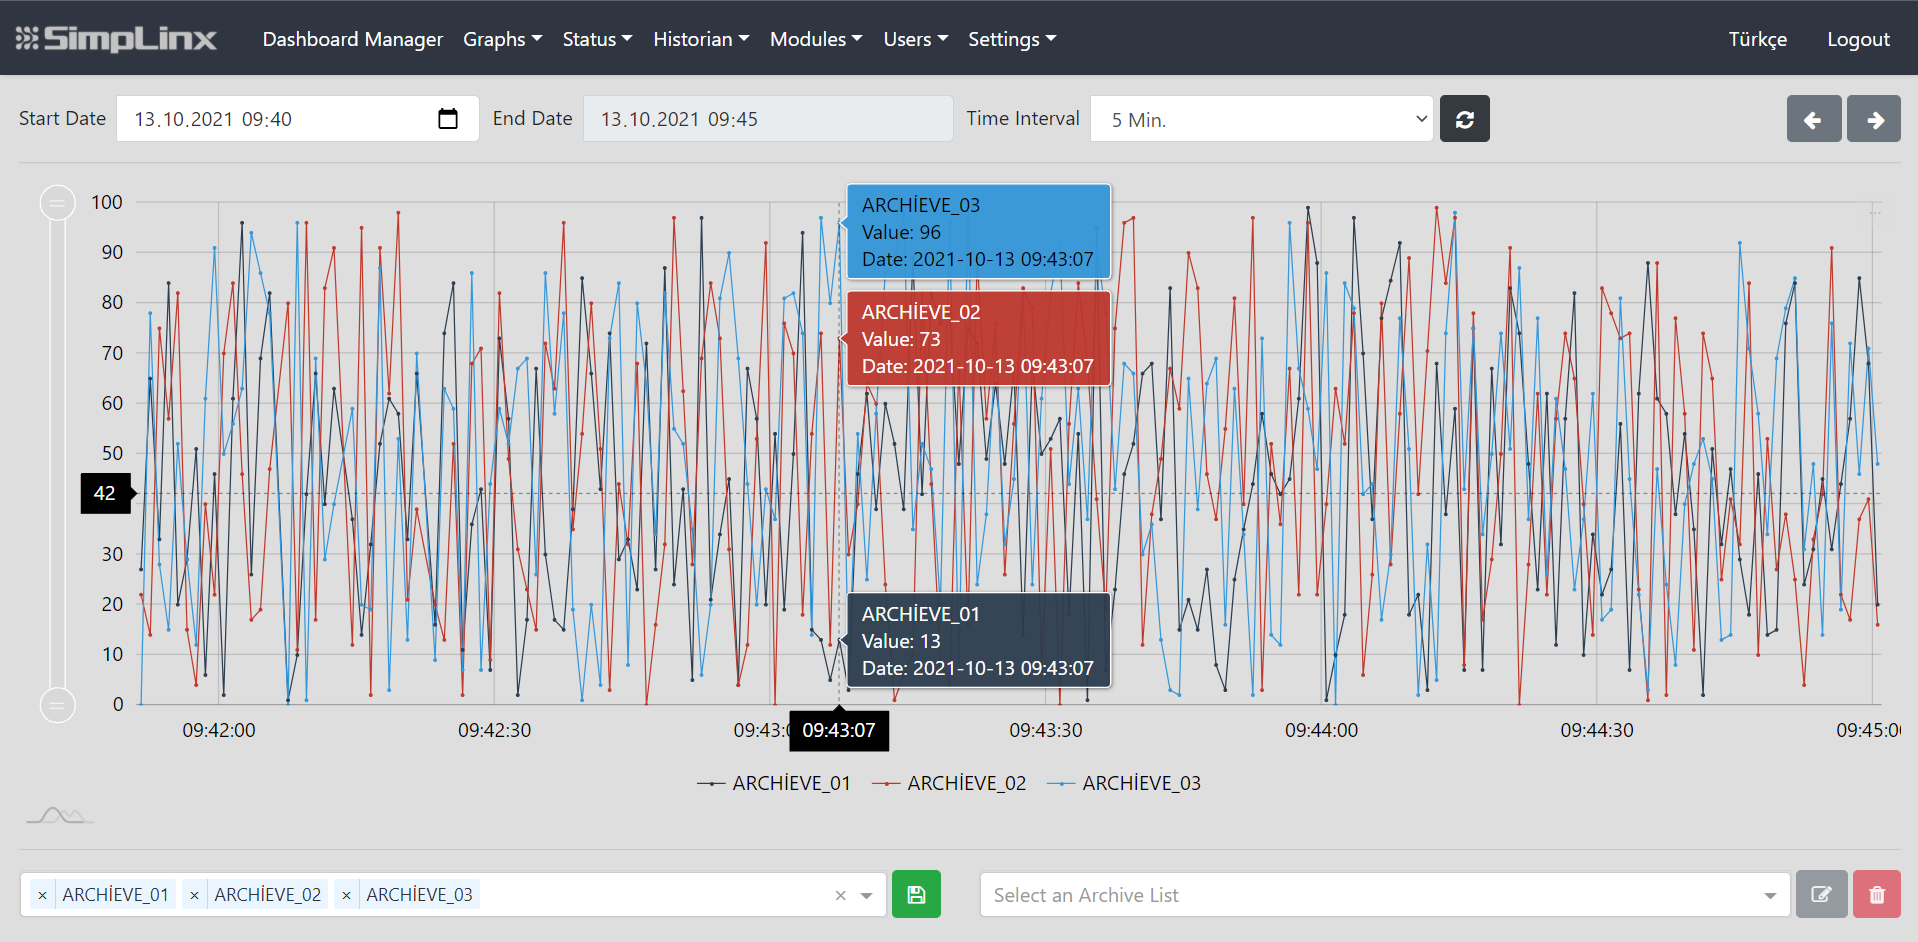
Section titled “Historian Chart Center Page”You can view the archive data for “Tag” that you select on the “Historian Chart Center” page.
-
Select “Archive” that you want to view from the list at the bottom left of the page.
-
You can add maximum 4 “Archive”.
-
After choosing your “Archive” to display,
-
With the boxes at the top of the page, set the range you want to display as “Start Date”,, “End Date” and “Time Interval”.
-
If you want a specific end date for chart, choose “End Date” but if you want a time interval for your chart, choose “Time Interval”. Only one of them will be active after selection.
-
Once you’ve set the time range, you can view your chart by pressing the “Refresh” button on the right.
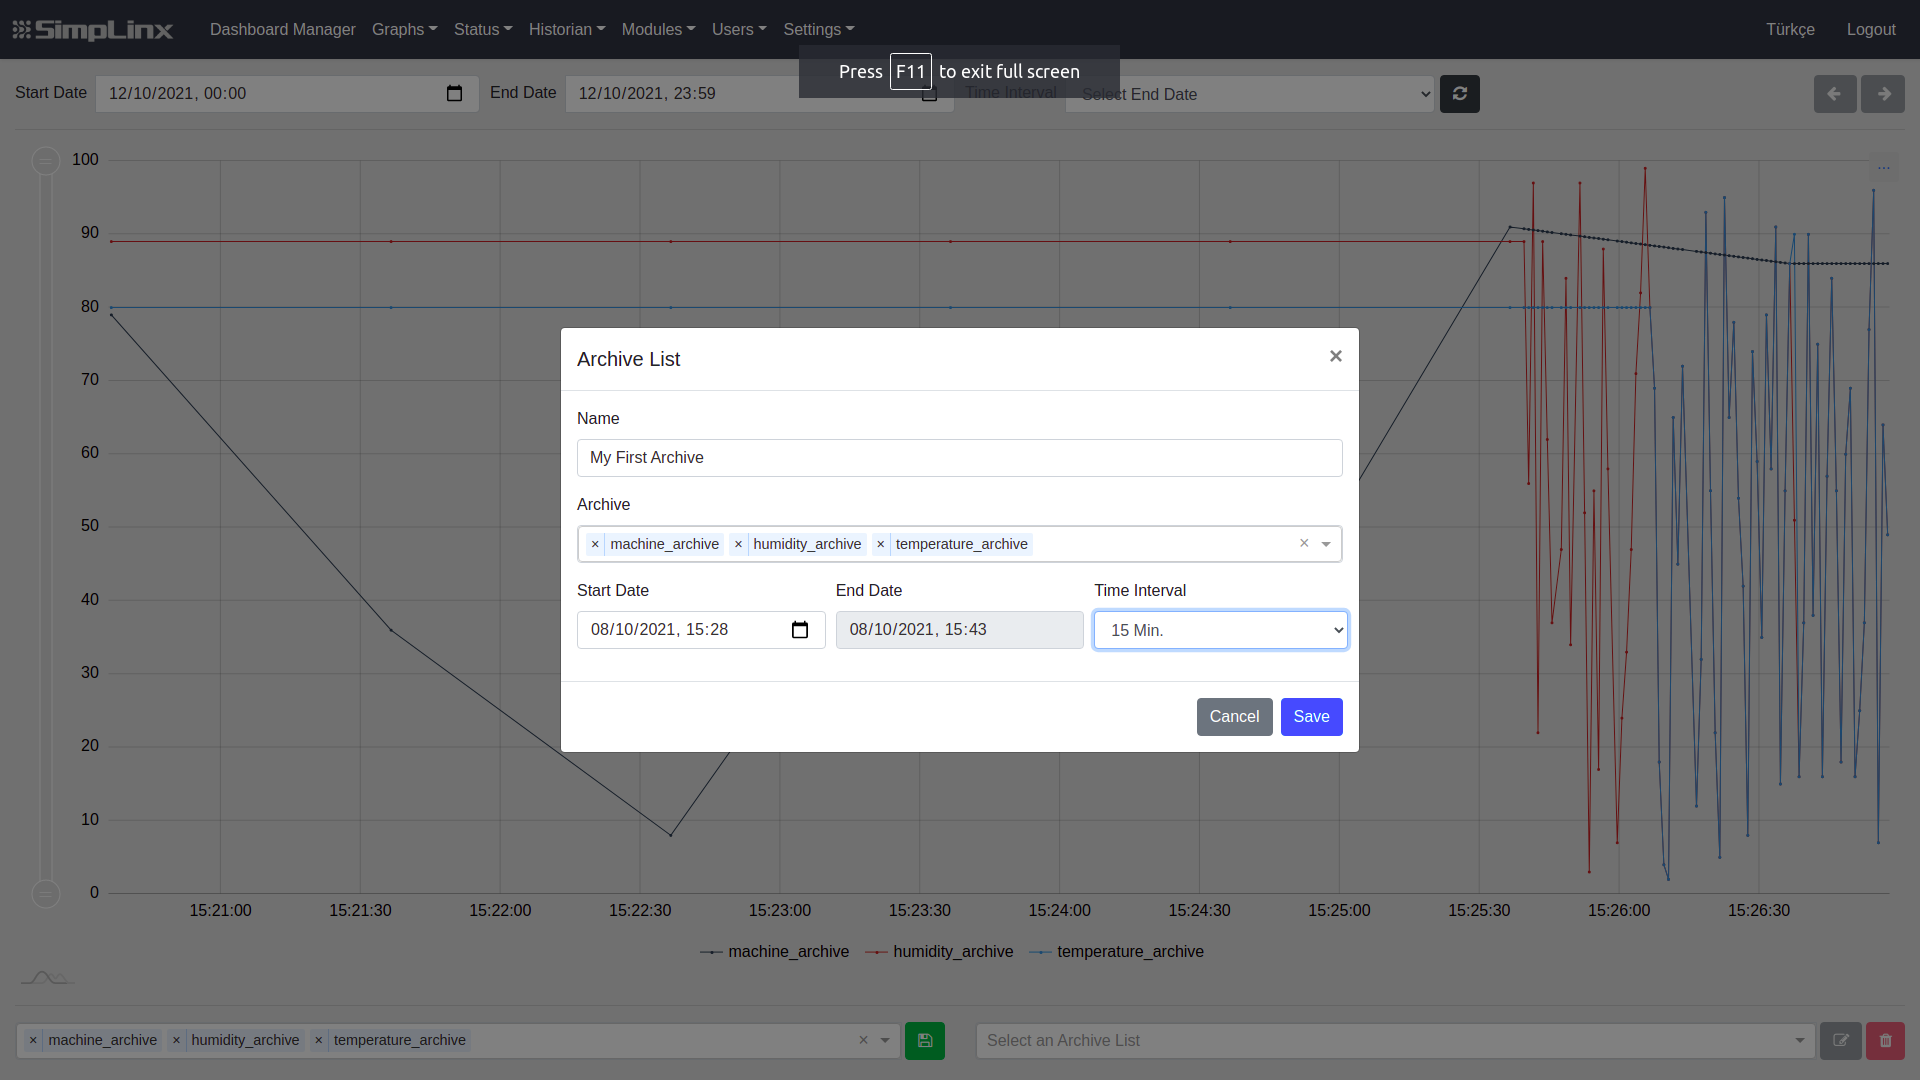
After you choose archives to display, you can add them to a archive list:
-
To do that, click green save button next to selected archives.
-
A new page will be appear, you can name for Archive list.
-
Also you can give specific “Start Date”, “End Date” or “Time Interval” (Optional).
-
Click “Save” button to save your Archive list.
-
After saving your Archive list, you can select your list to display chart at the right bottom of the page.
With the “Options” button in the upper-right corner of the chart;
-
You can export the graphic in “PNG”,“JPG”,“SVG”,”GIF” and “PDF” formats.
-
You can export graphic data’s in “JSON”,”CSV” and “XLSX” formats.
-
You can print a snapshot of the chart with the “Print” option.
Realtime Chart Center Page
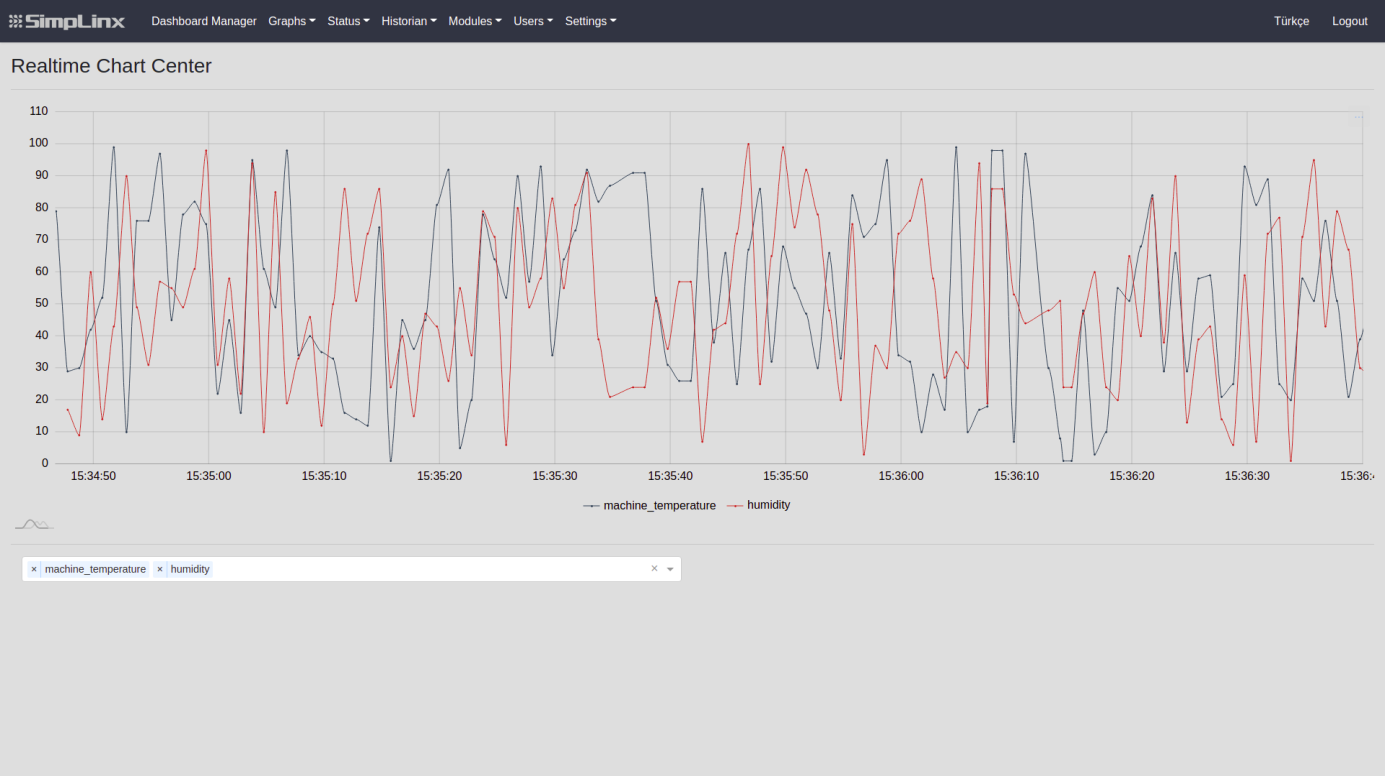
Section titled “Realtime Chart Center Page”On the “Realtime Chart Center” page, you can view real-time data of “Tag” that you choose.
-
Select “Tag” that you want to view from the list at the bottom left of the page
-
Delete the “Tag” that is added with the left of “Tag” name, click “x” button.
With the “Options” button in the upper-right corner of the chart;
-
You can export the graphic in “PNG”,“JPG”,“SVG”,”GIF” and “PDF” formats.
-
You can export graphic data’s in “JSON”,”CSV” and “XLSX” formats.
-
You can print a snapshot of the chart with the “Print” option.
State Center Page
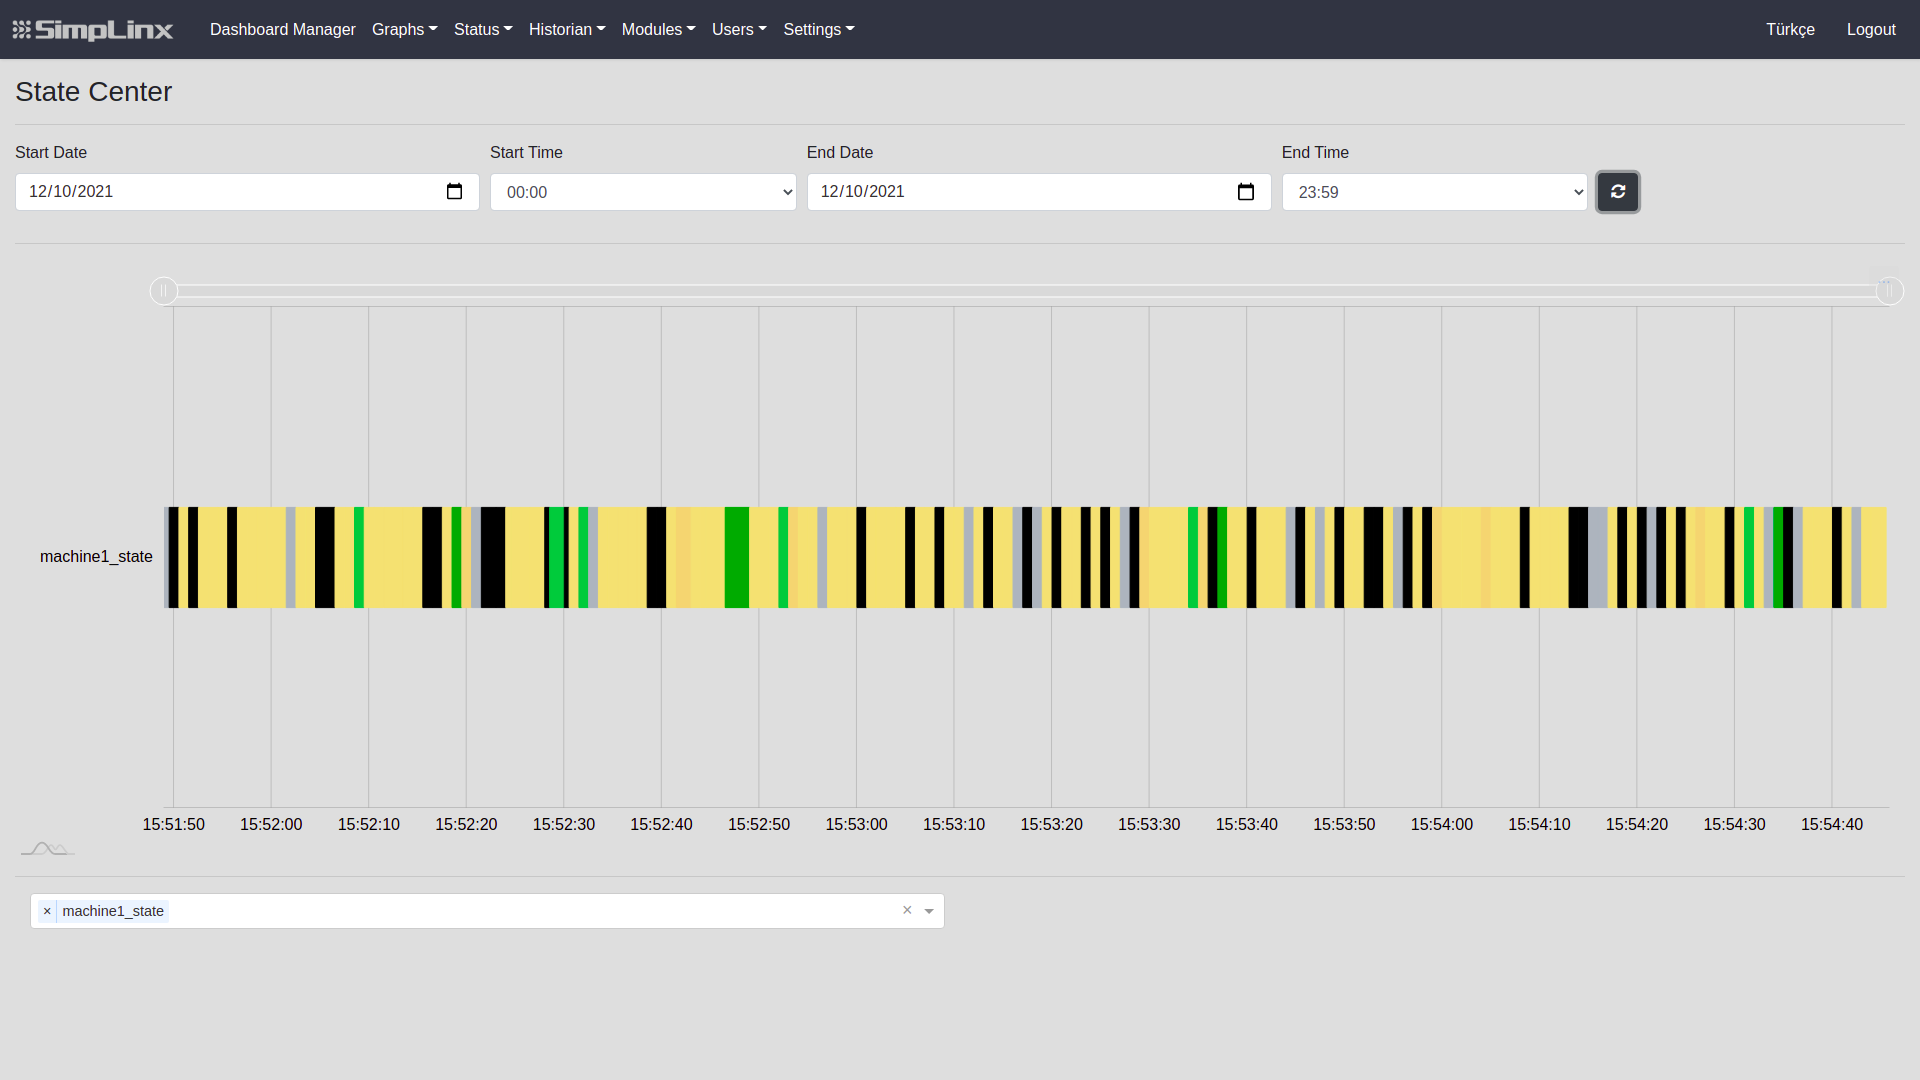
Section titled “State Center Page”On the “State Center” page, you can view the machine state data for “Machine State” that you choose.
-
Select “Machine State” that you want to view from the list at the bottom left of the page
-
You can add your selection with clicking “Machine State” and delete with “x” button left of “Machine State” name.
-
Set the range you want to display with boxes at the top of the page as “Start Date”, “Start Time”, “End Date” and “End time”.
-
Once you’ve set the time interval, you can view your chart by pressing the “Refresh” button on the right.
With the “Options” button in the upper-right corner of the chart;
-
You can export the graphic in “PNG”,“JPG”,“SVG”, “GIF” and “PDF” formats.
-
You can export graphic data’s in “JSON”,”CSV” and “XLSX” formats.
-
You can print a snapshot of the chart with the “Print” option
Status Page
Section titled “Status Page”On the “Status” page;
-
The status of the “Tag” you’ve added
-
The status of the “Driver” you have added
-
If exist, the status of the “Cloud Connector” connection you can view it.
-
If exist, the status of the “SMS Connector” connection you can view it.
-
If exist, the status of the “SQL Connector” connection
you can view it.
Tag Status
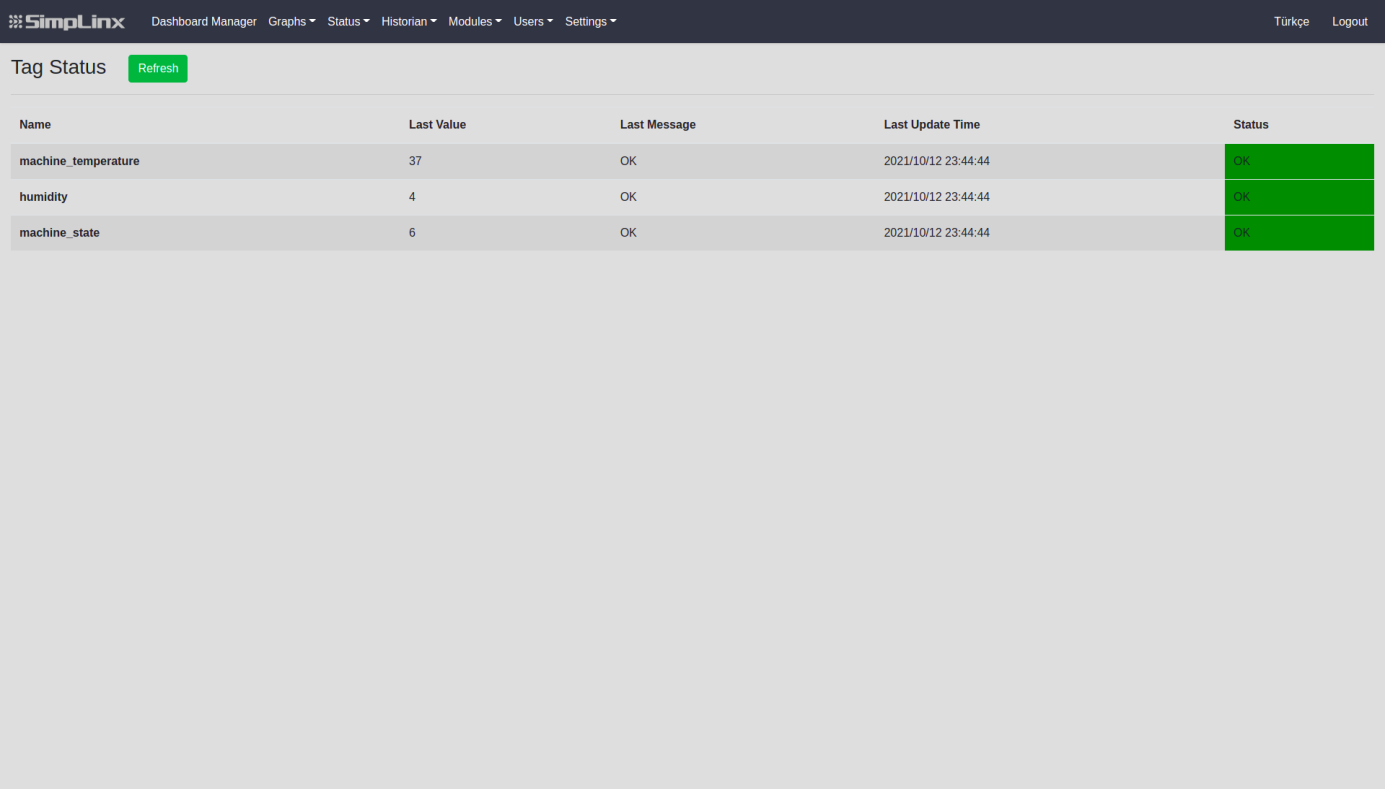
Section titled “Tag Status”“Tag” that you added on the “Tag Status” page is shown as a table. Table has;
-
Name
-
Last Value
-
Last Message
-
Last Updated Time
-
Status
columns. You can update table data with the “Refresh” button at the top left.
Driver Status
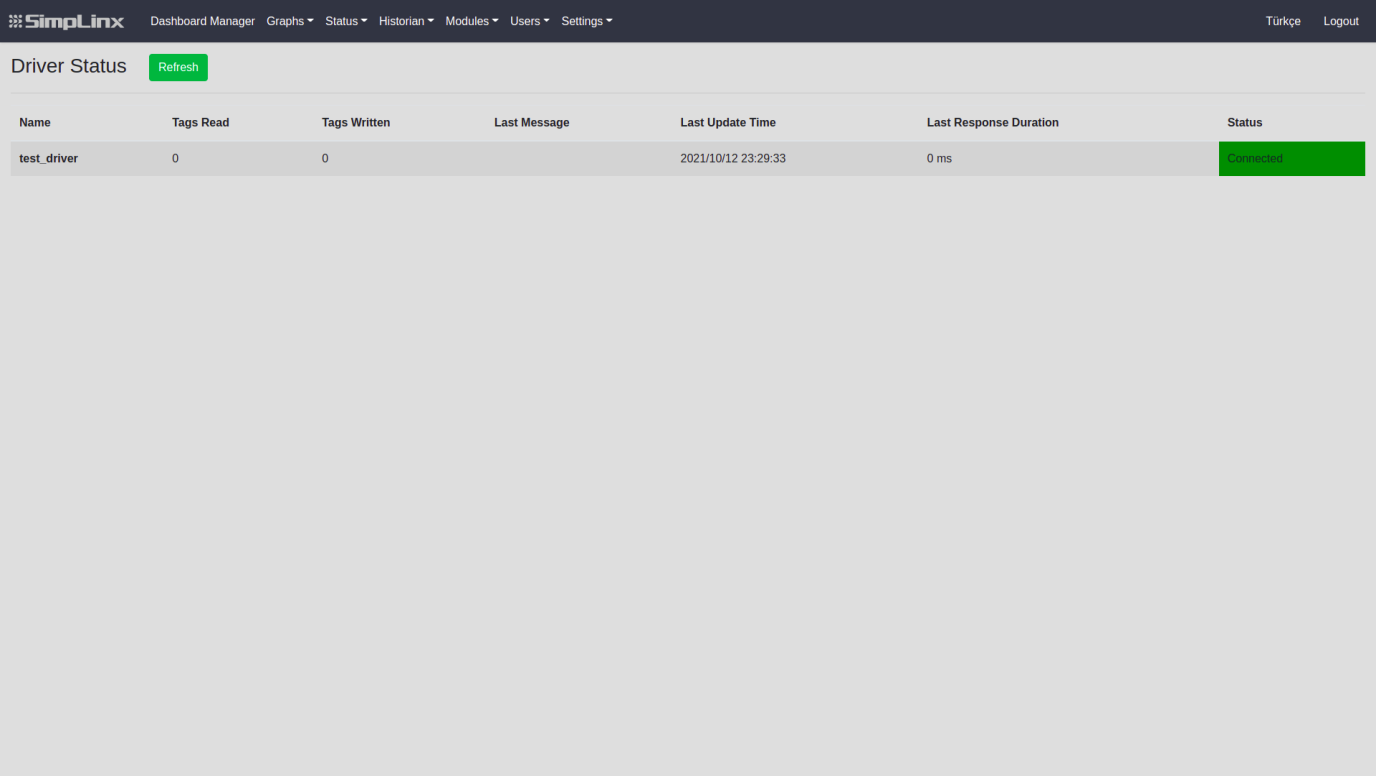
Section titled “Driver Status”“Driver” that you have added on the “Driver Status” page is shown as a table. Table has these columns;
-
Name
-
Tags Read
-
Tags Written
-
Last Message
-
Last Update Time
-
Last Response Duration
-
Status
You can update table data with the “Refresh” button at the top left.
Cloud Connector Status
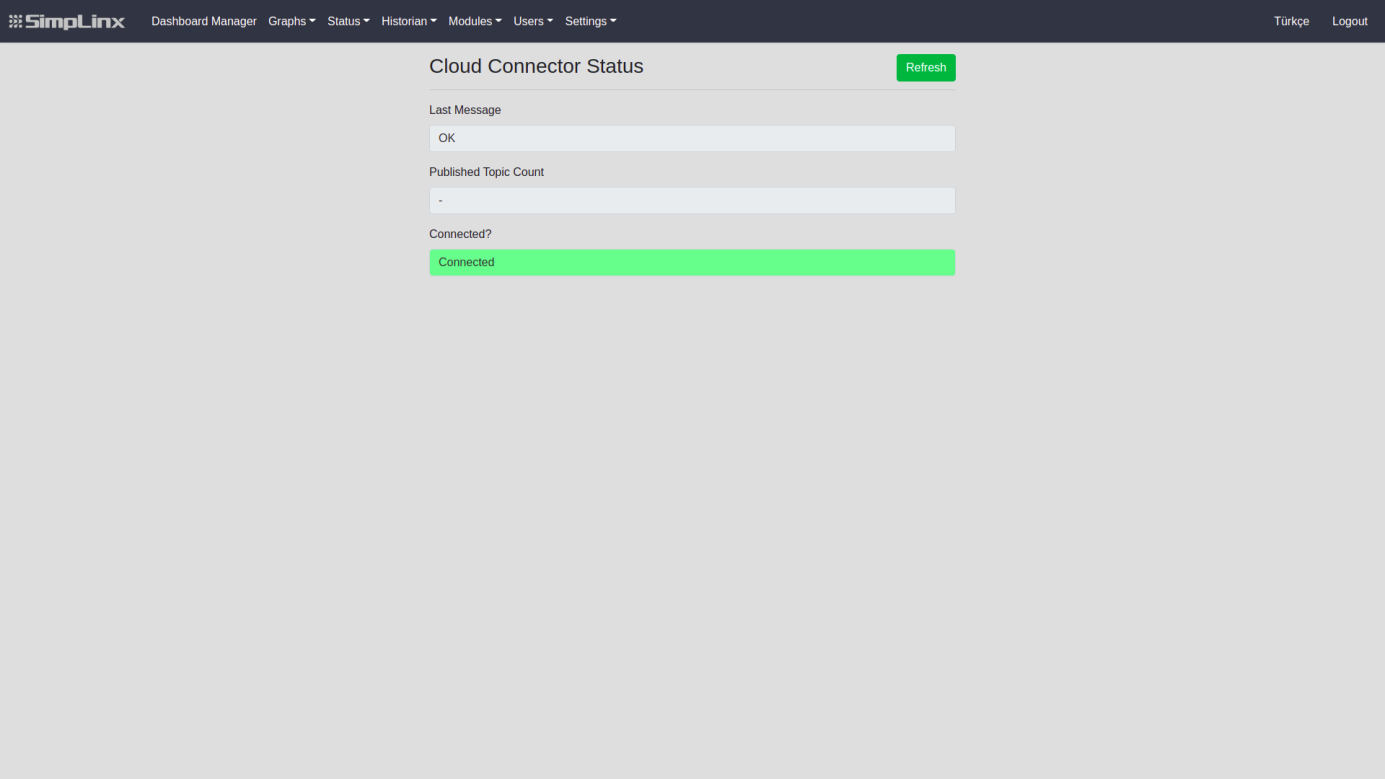
Section titled “Cloud Connector Status”On the “Cloud Connector Status” page;
-
Last Message
-
Published Topic Count
-
Connected?
Information’s of the cloud connection you have made is displayed. You can update cloud connection data with the “Refresh” button at the top left.
SMS Connector Status
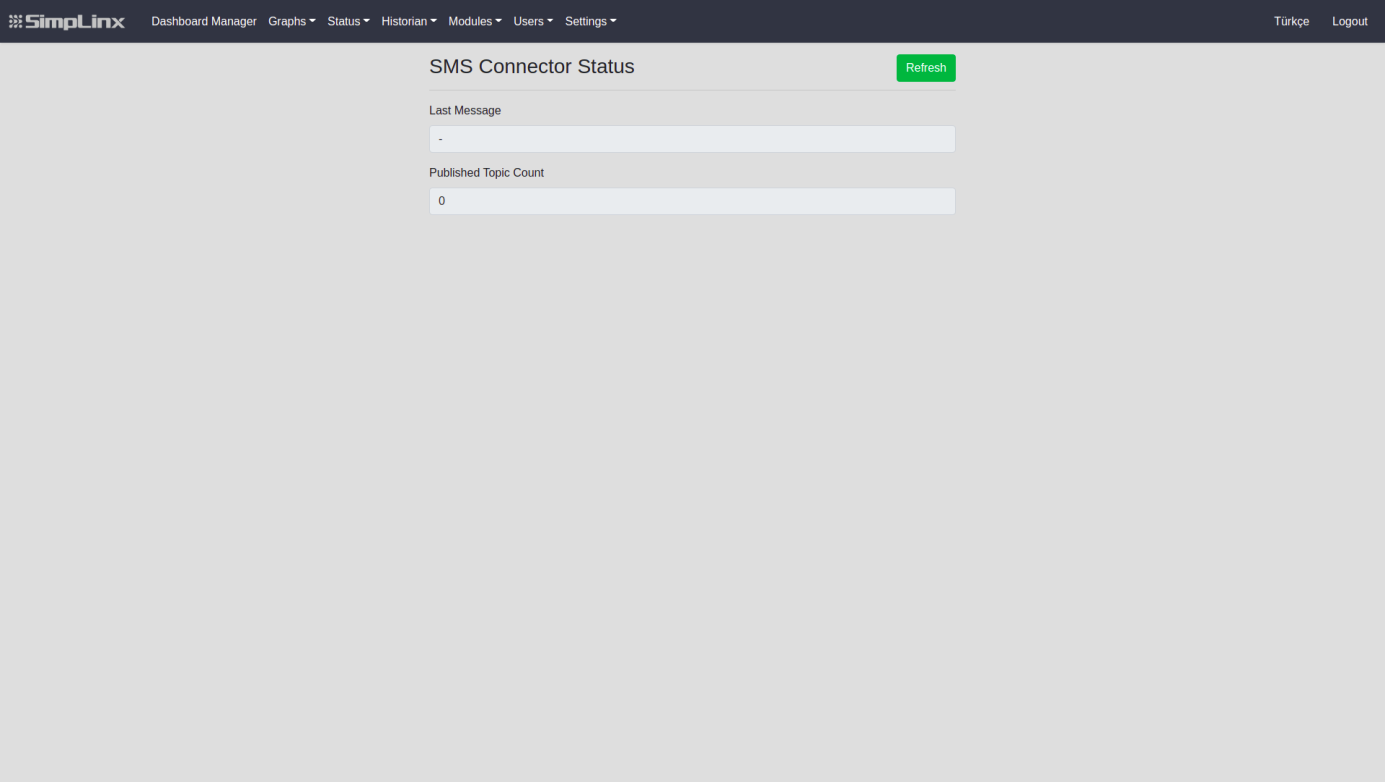
Section titled “SMS Connector Status”You can see the status of your SMS account that you have linked to on the “SMS Connector Status” page and the number of “Topics” created and sent.
You can update the data with the “Refresh” button at the top left.
SQL Connector Status
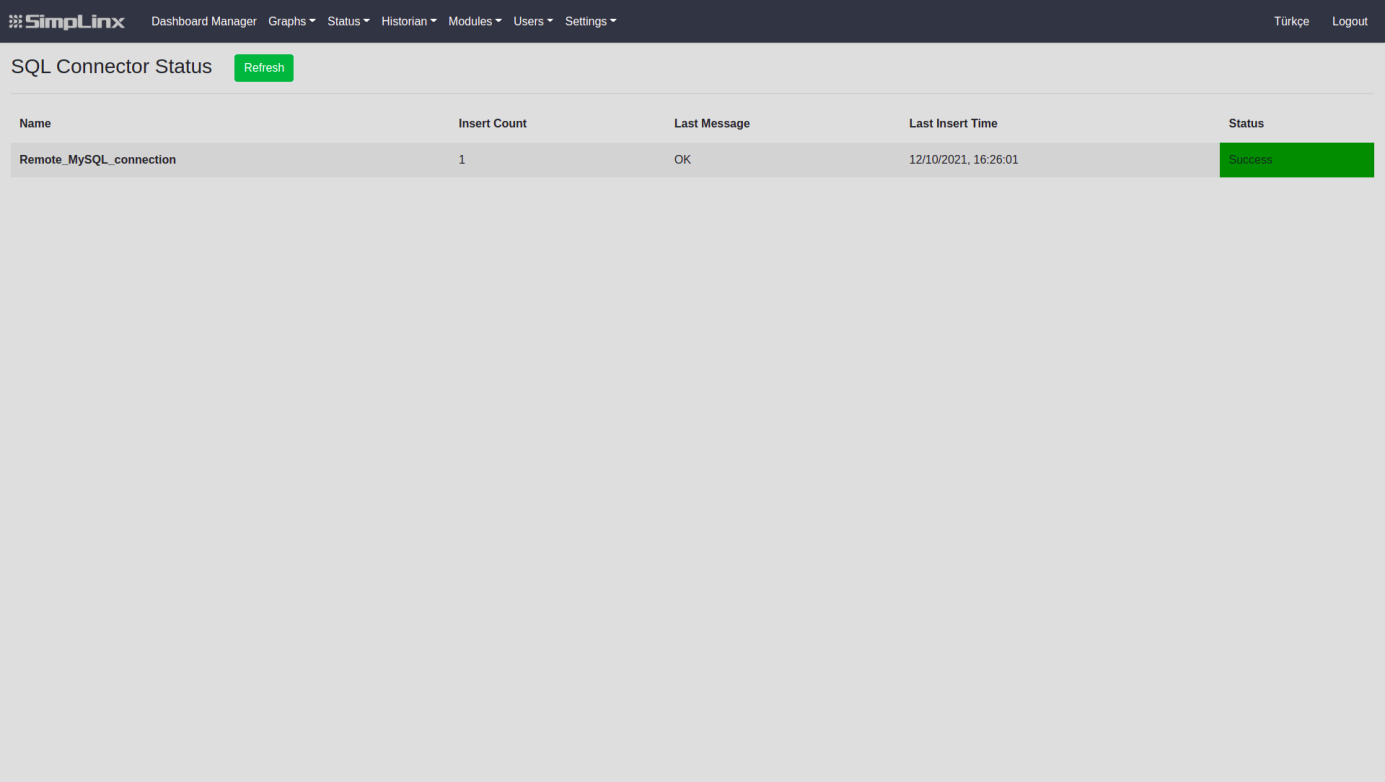
Section titled “SQL Connector Status”On the “SQL Connector Status” page;
-
Name
-
Insert Count
-
Last Message
-
Last Insert Time
-
Status
Informations’ of SQL connection you have made is displayed. You can update SQL connection data with the “Refresh” button at the top left.
Historian
Section titled “Historian”The pages on this tab list the time-based breakdown of records that occur as a result of the settings made on pages under the “Modules” tab. Pages consist of several buttons and data from the table. These are;
- Buttons
- Data
 | Shows the page you are in the table and the total number of pages. The table generates 1 page for each 100 data. |
|---|
This page lists the values that are recorded and the values for system events when the terms of the events you create on the “Modules”—>“Event” page are met.
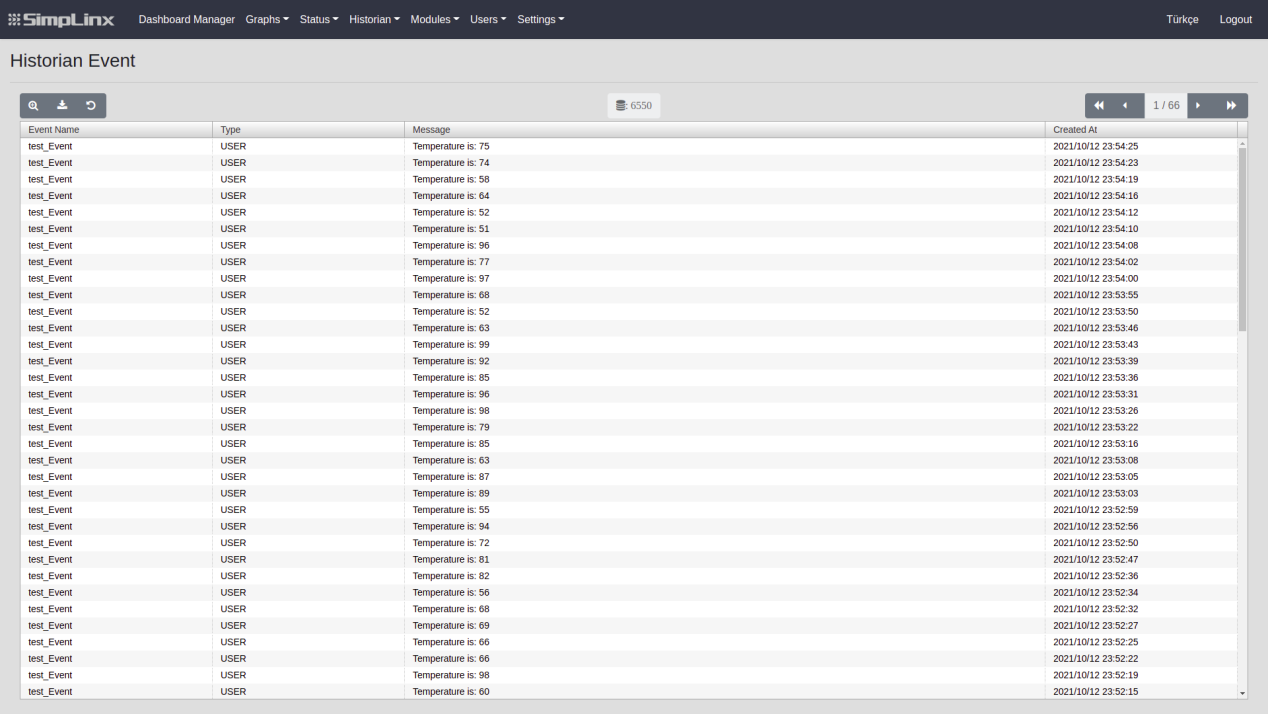
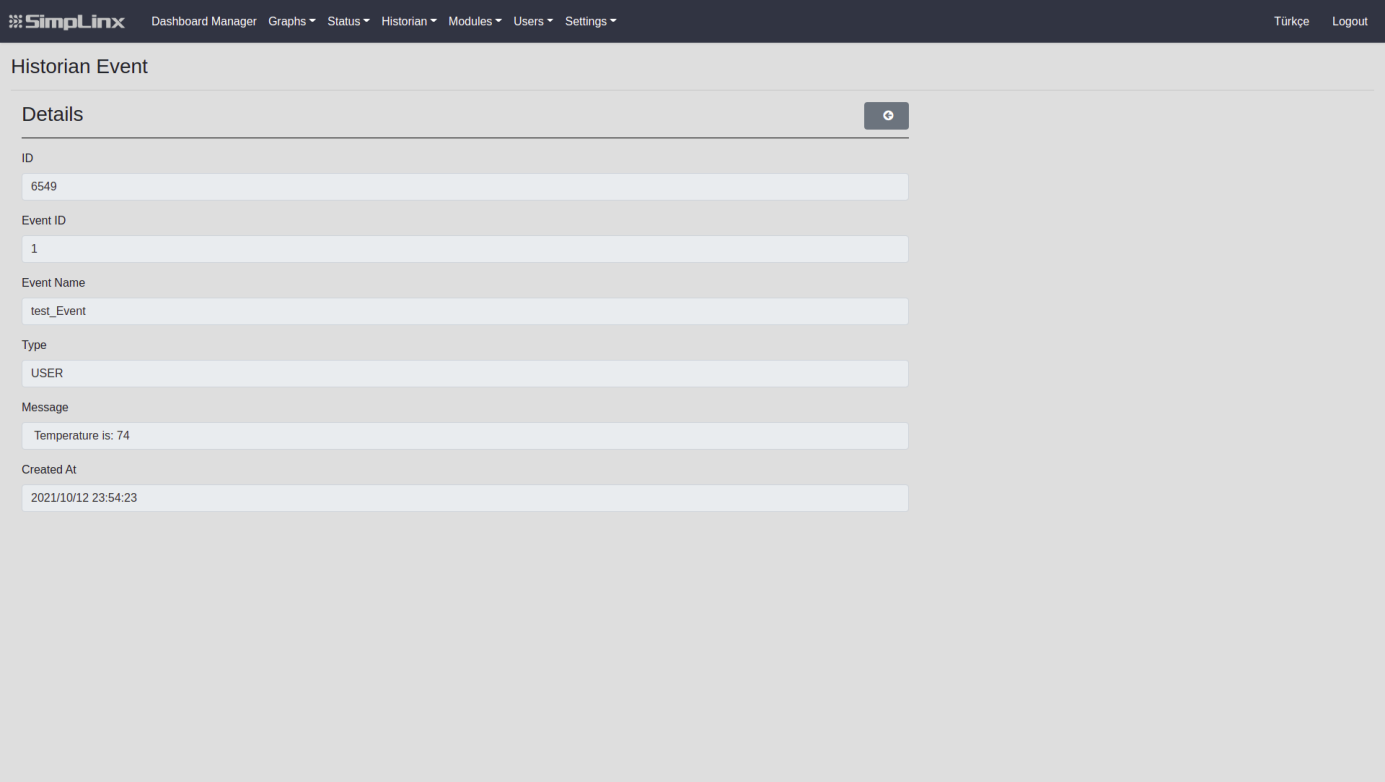
If you wish, you can double-press the event created from the list or select the event and access the details of the event with the button
Archive
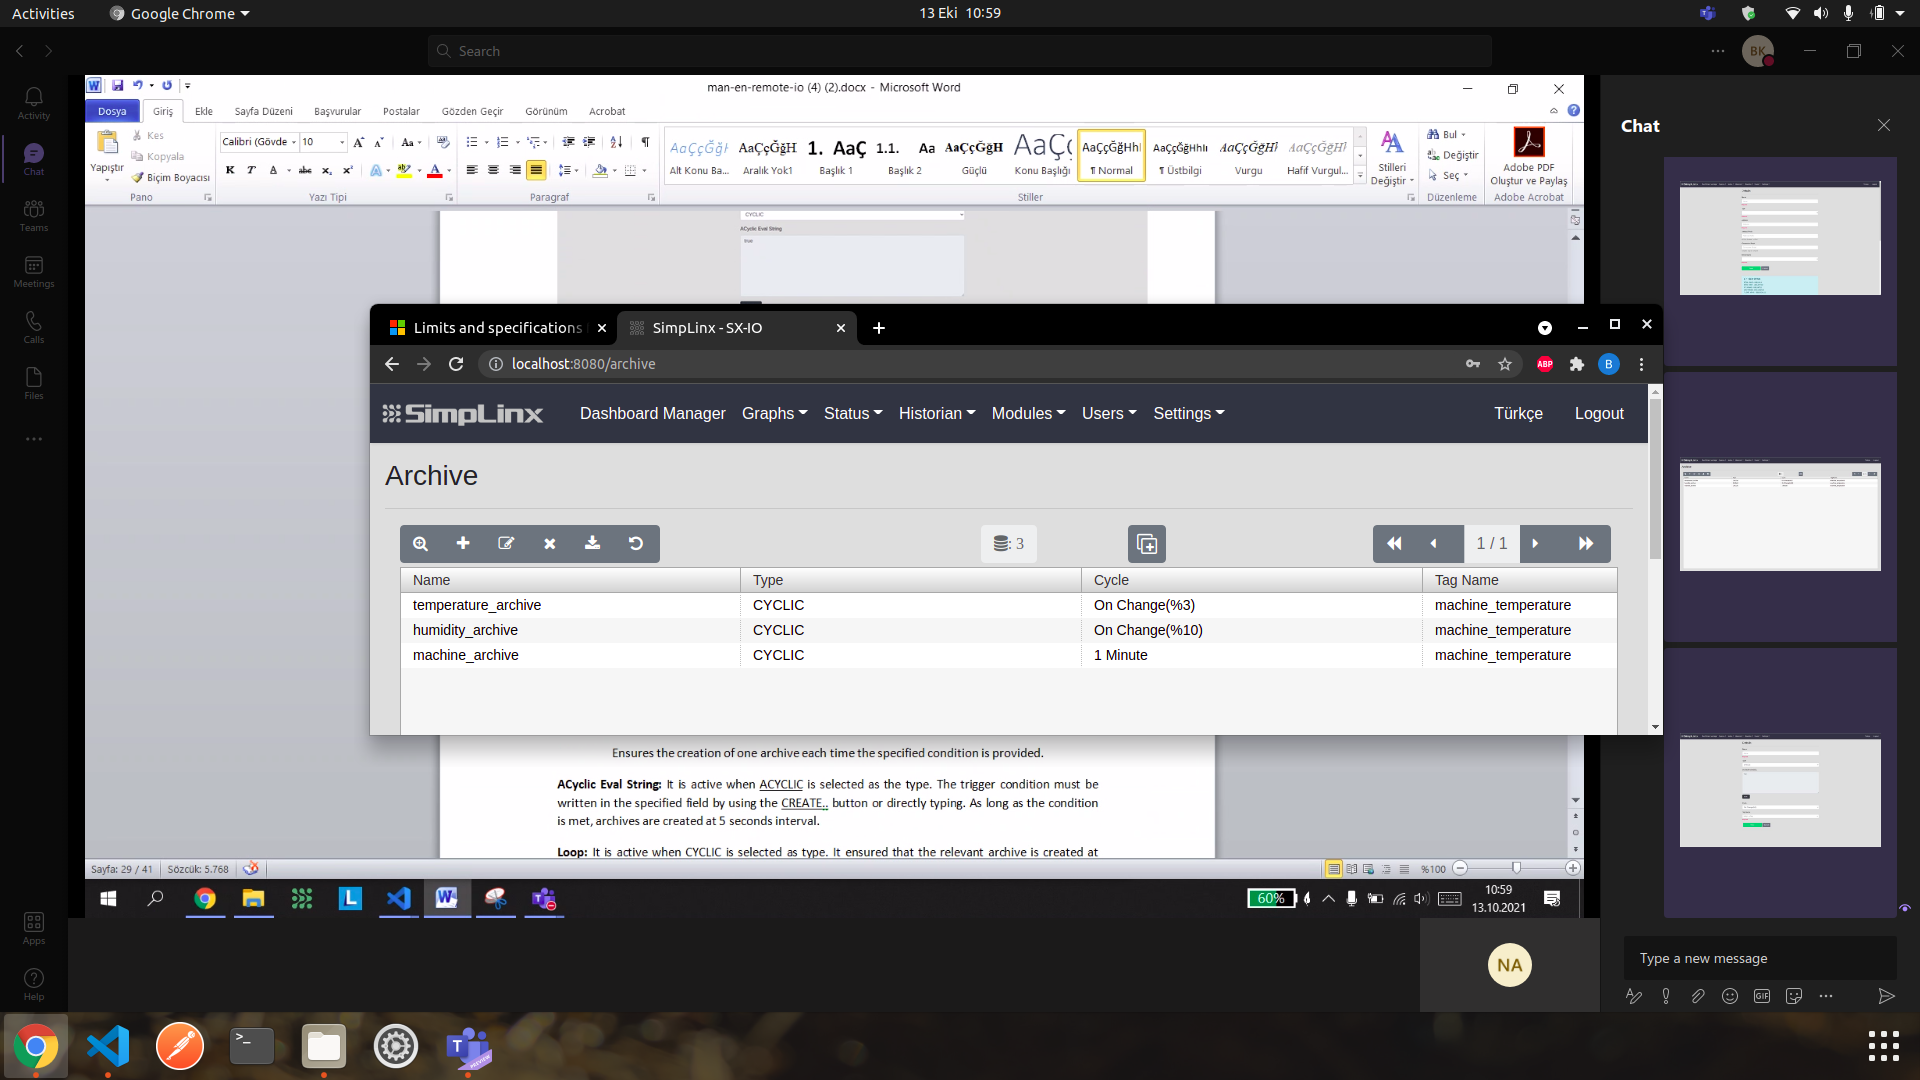
Section titled “Archive”This page lists the values recorded when the terms are met in the archives that you create on the “Modules”—>“Archive” page.
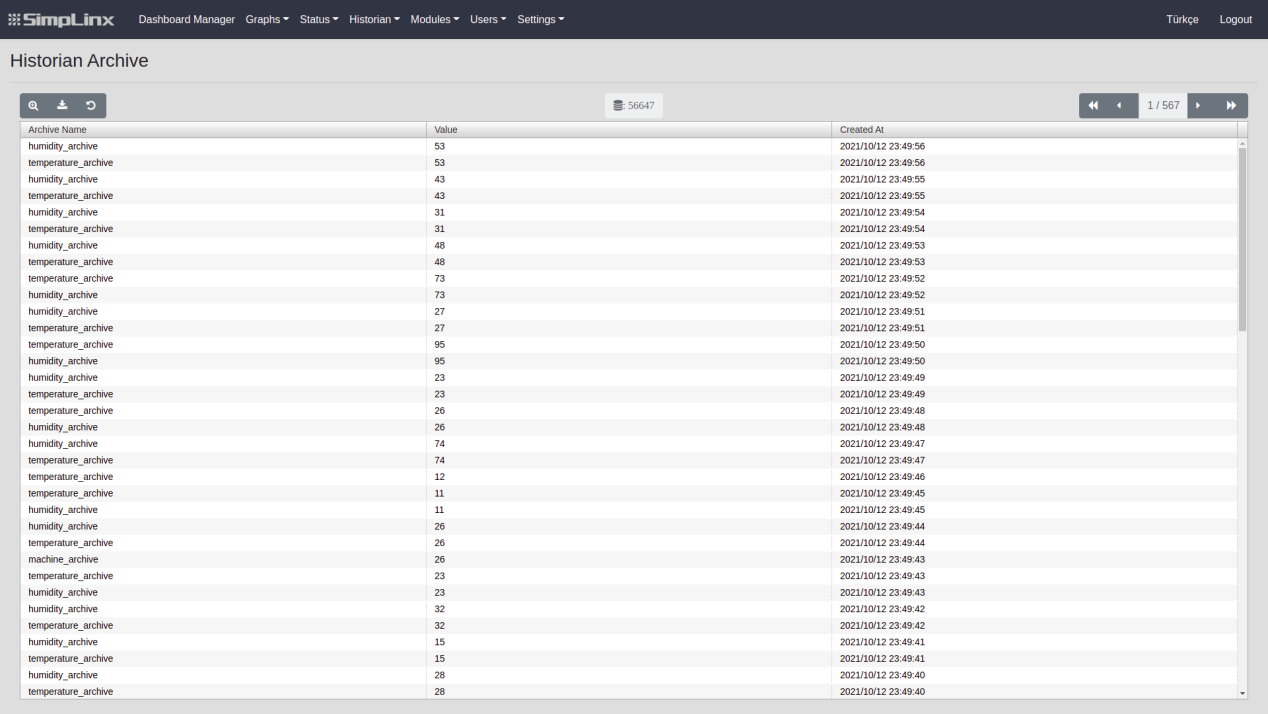
If you wish, you can access the details of the archive by double clicking from the list or by selecting the archive and clicking the button
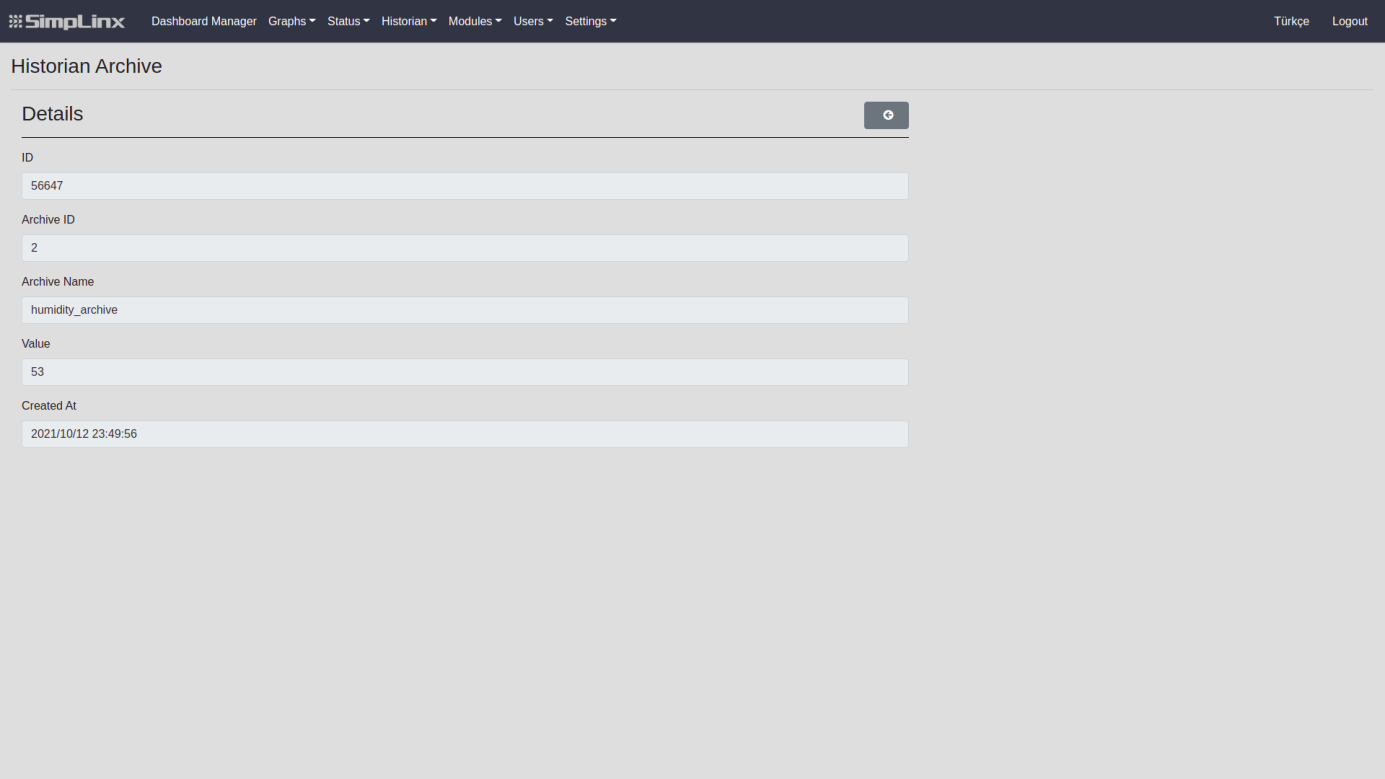
Machine State
Section titled “Machine State”This page lists the historically recorded values of the devices that you create on the “Modules”—>“Machine State” page.
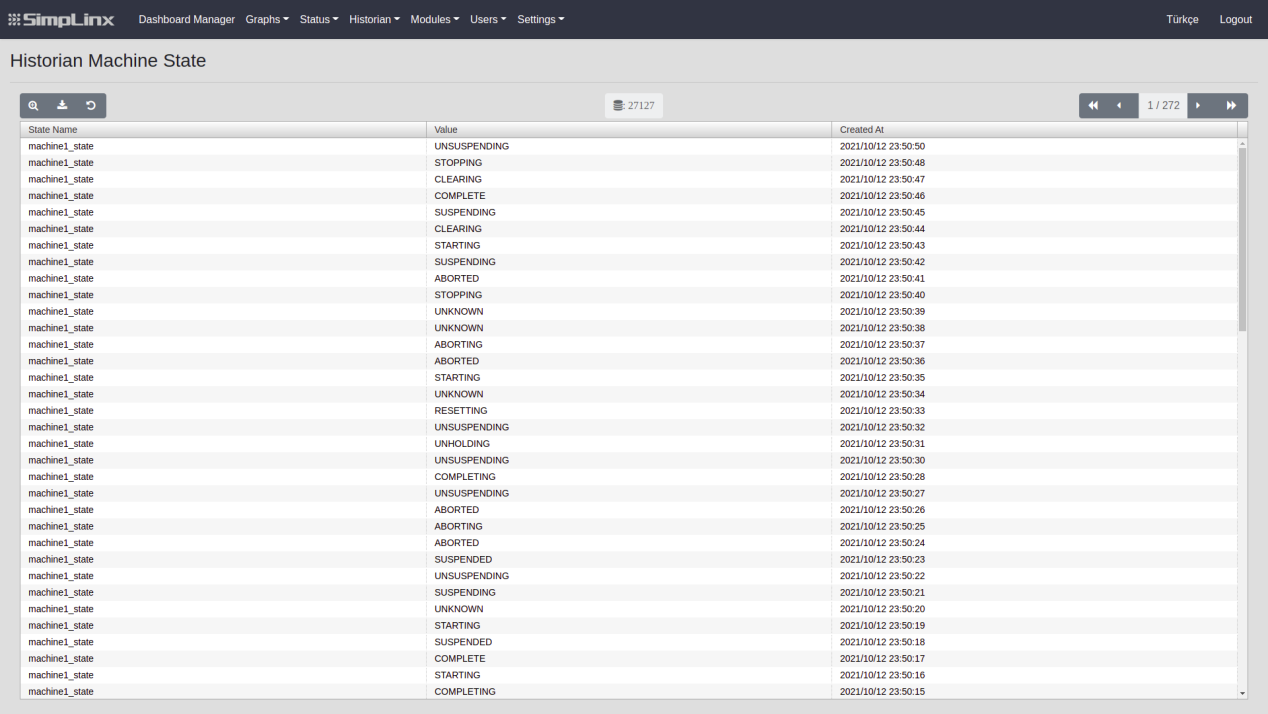
If you wish, you can access the details of the machine state by double clicking from the list or by selecting the state and clicking the button
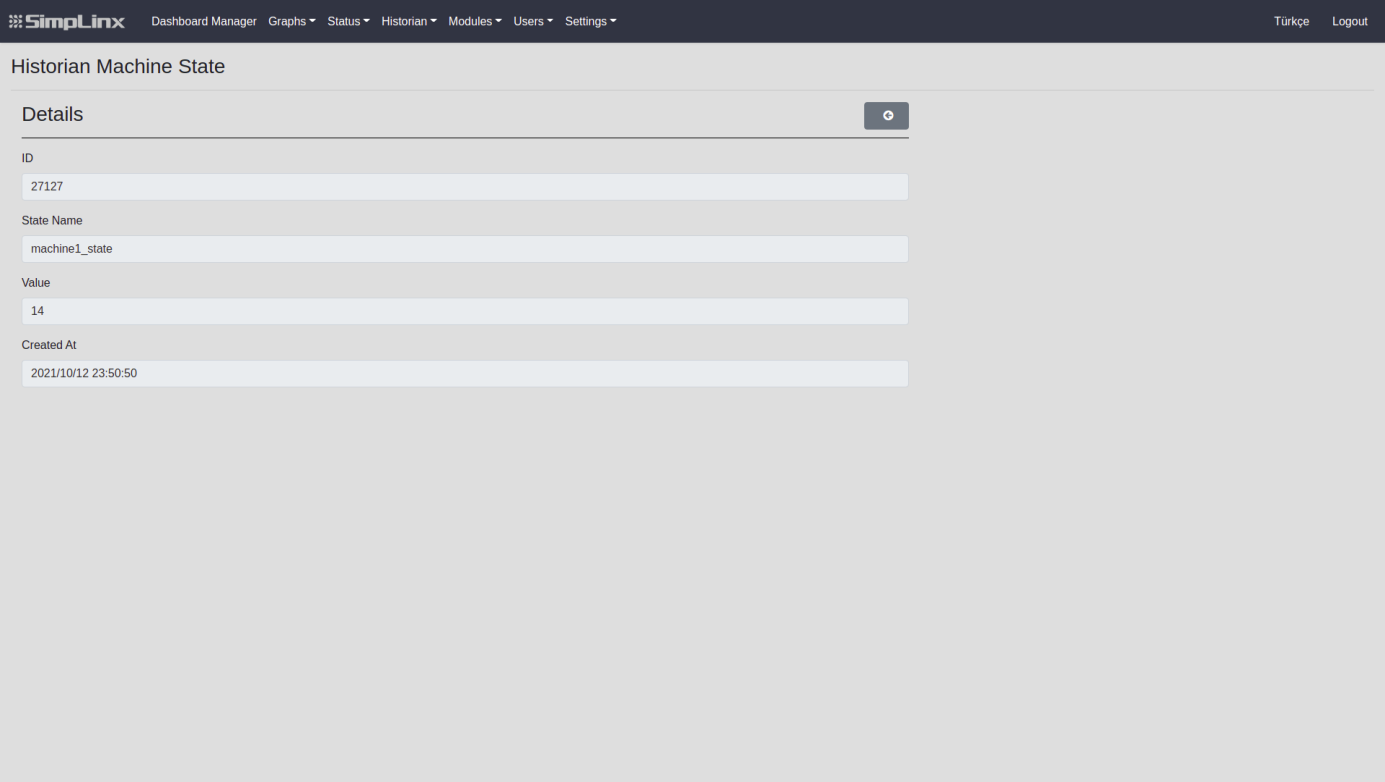
On this page, information about the mails sent when the events are triggered in the records you created on the “Modules”->”Email” page is listed.
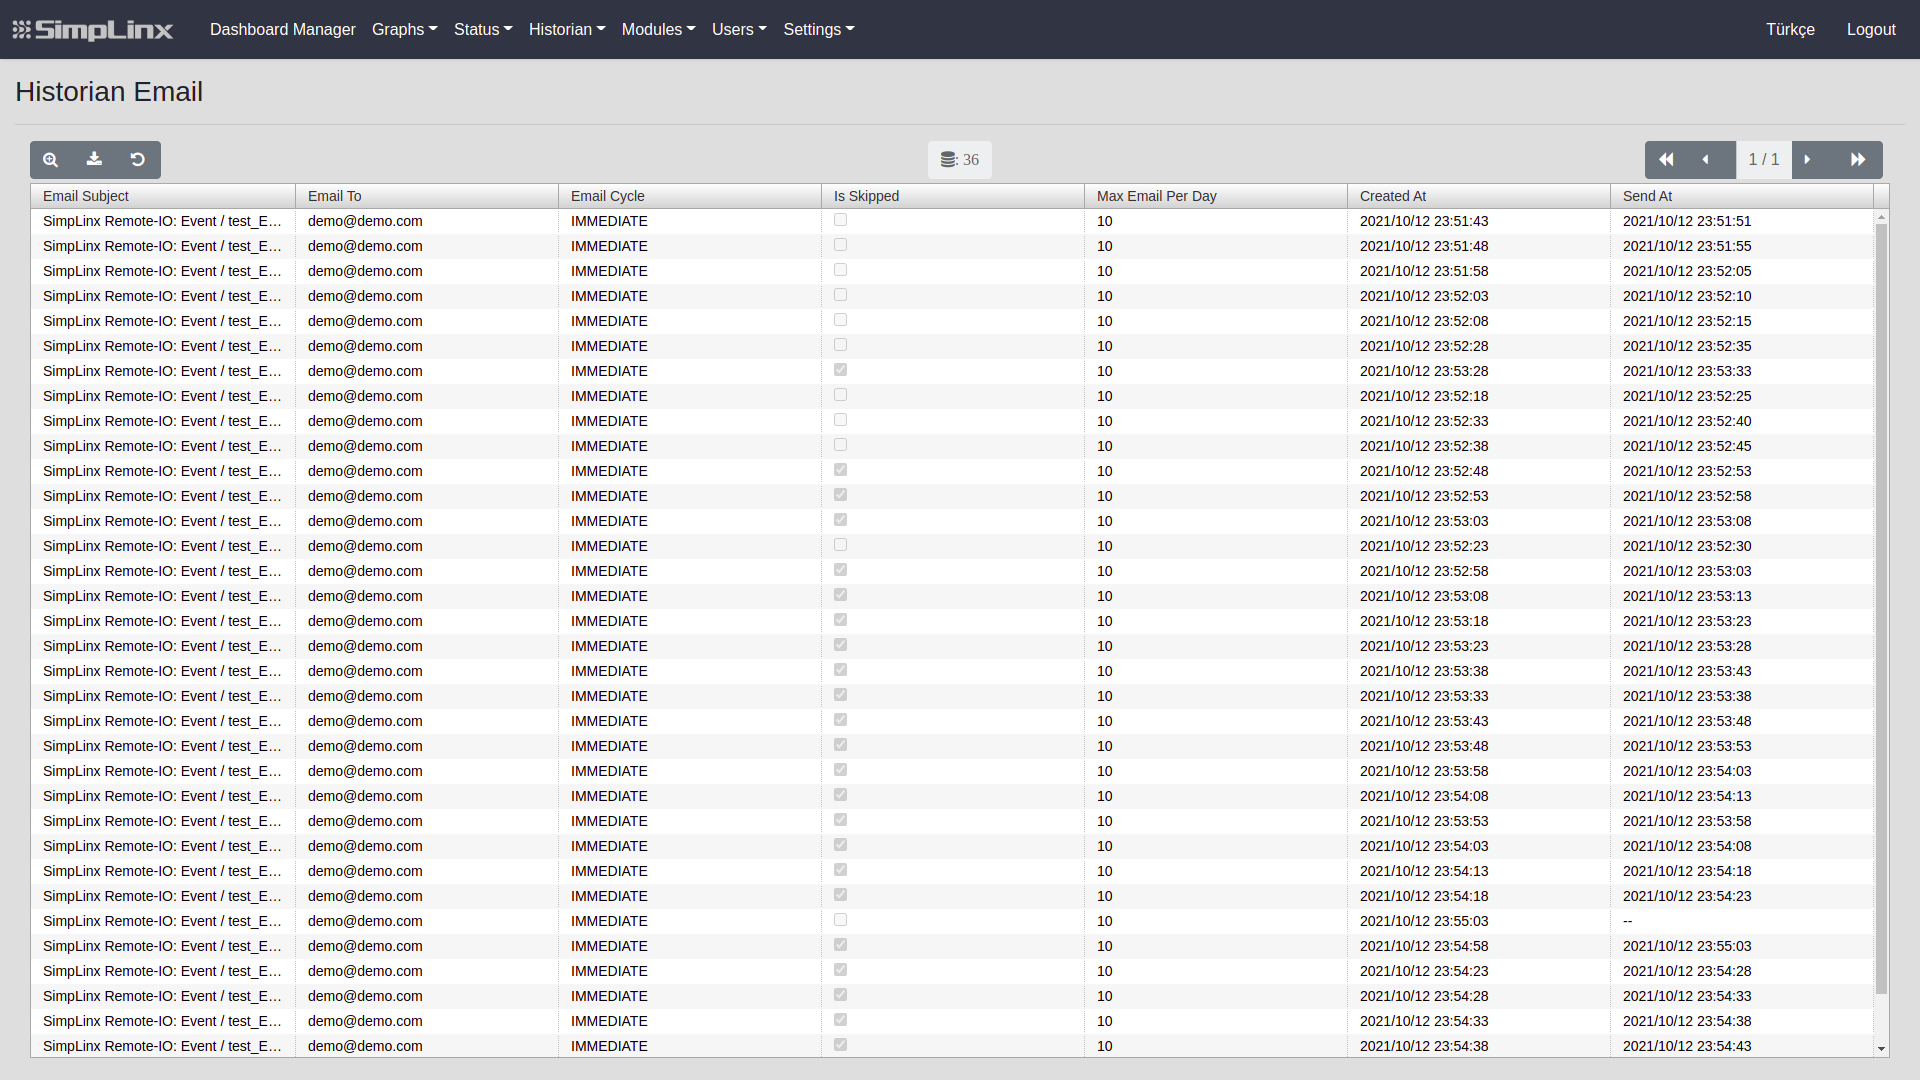
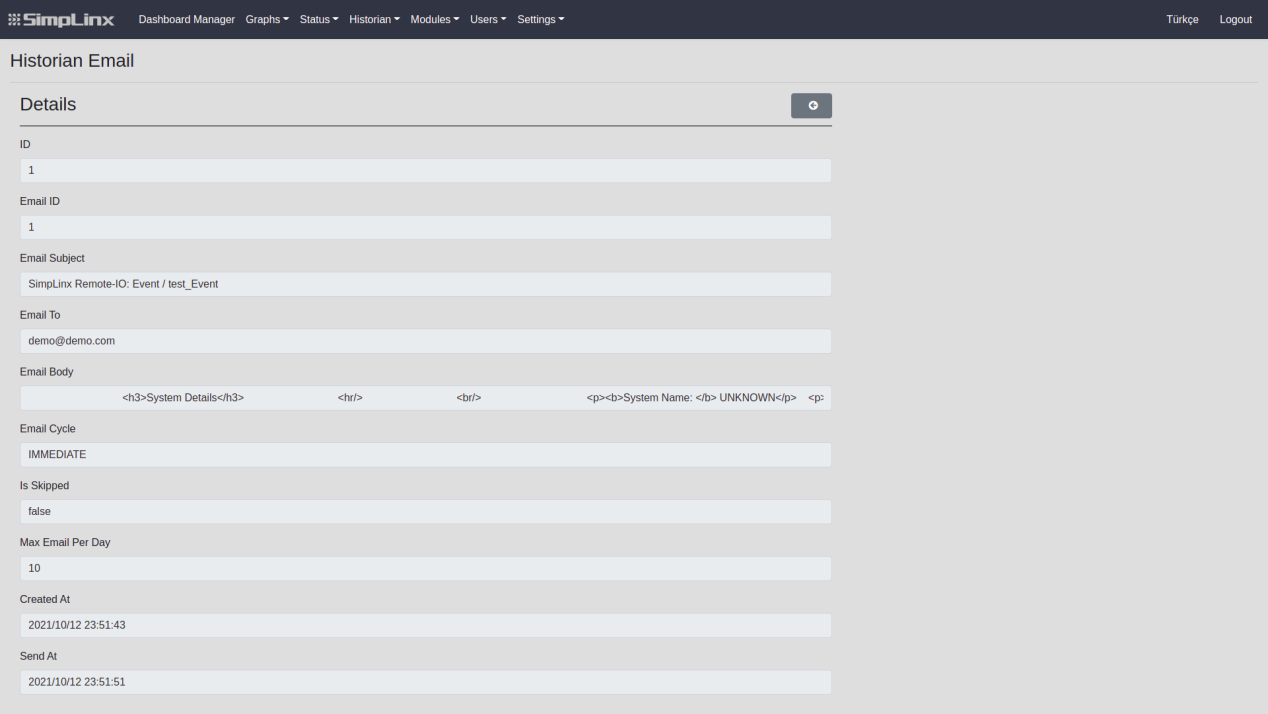
If you wish, you can access the details of the email record by double clicking from the list or by selecting the email record and clicking the button
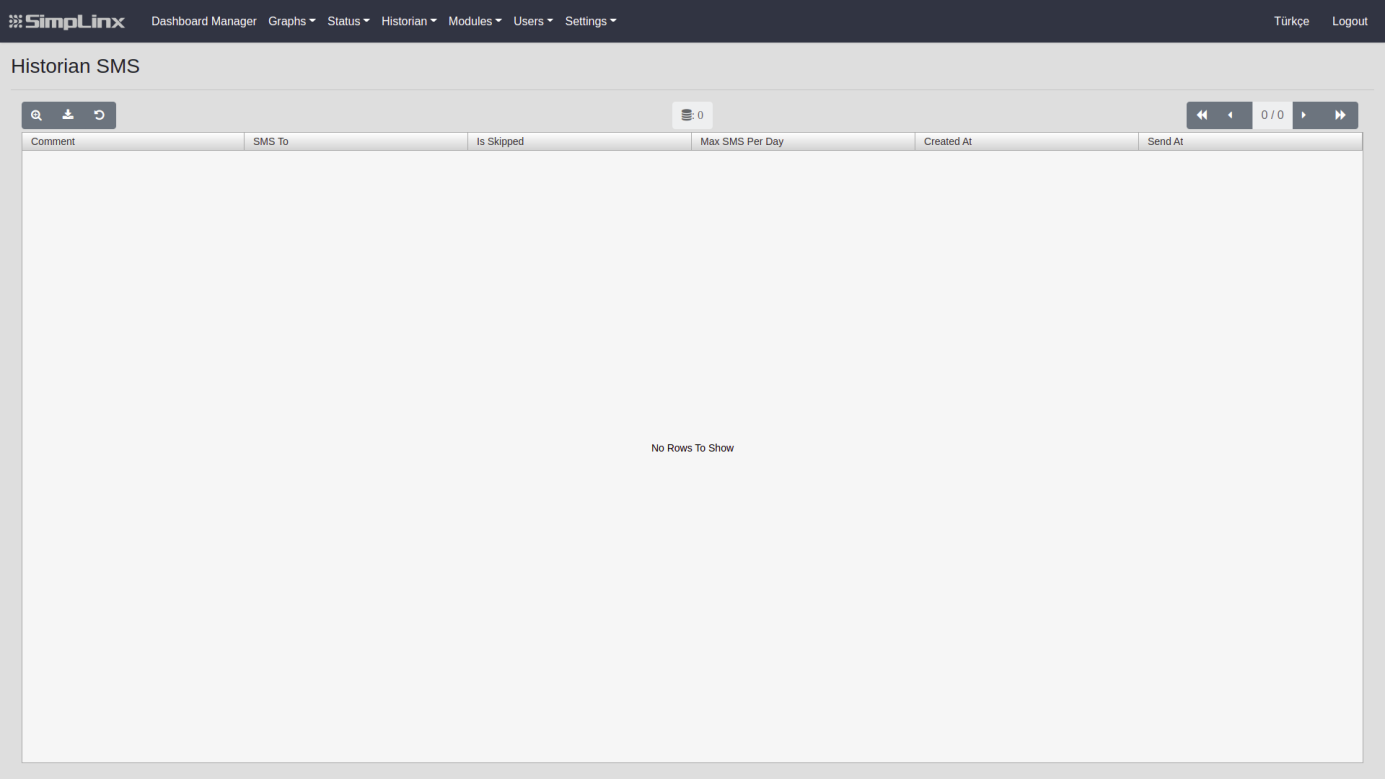
This page lists information about SMS sent when the events in the records that you create on the “Modules”—>“SMS” page are provided.
If you wish, you can access the details of the sent SMS by double clicking on the SMS record created from the list or by selecting the SMS record and clicking the button
Cloud Topic
Section titled “Cloud Topic”This page lists information about topics sent to the cloud when the terms of the records you create on the “Modules”—>“Cloud Topic” page are met.
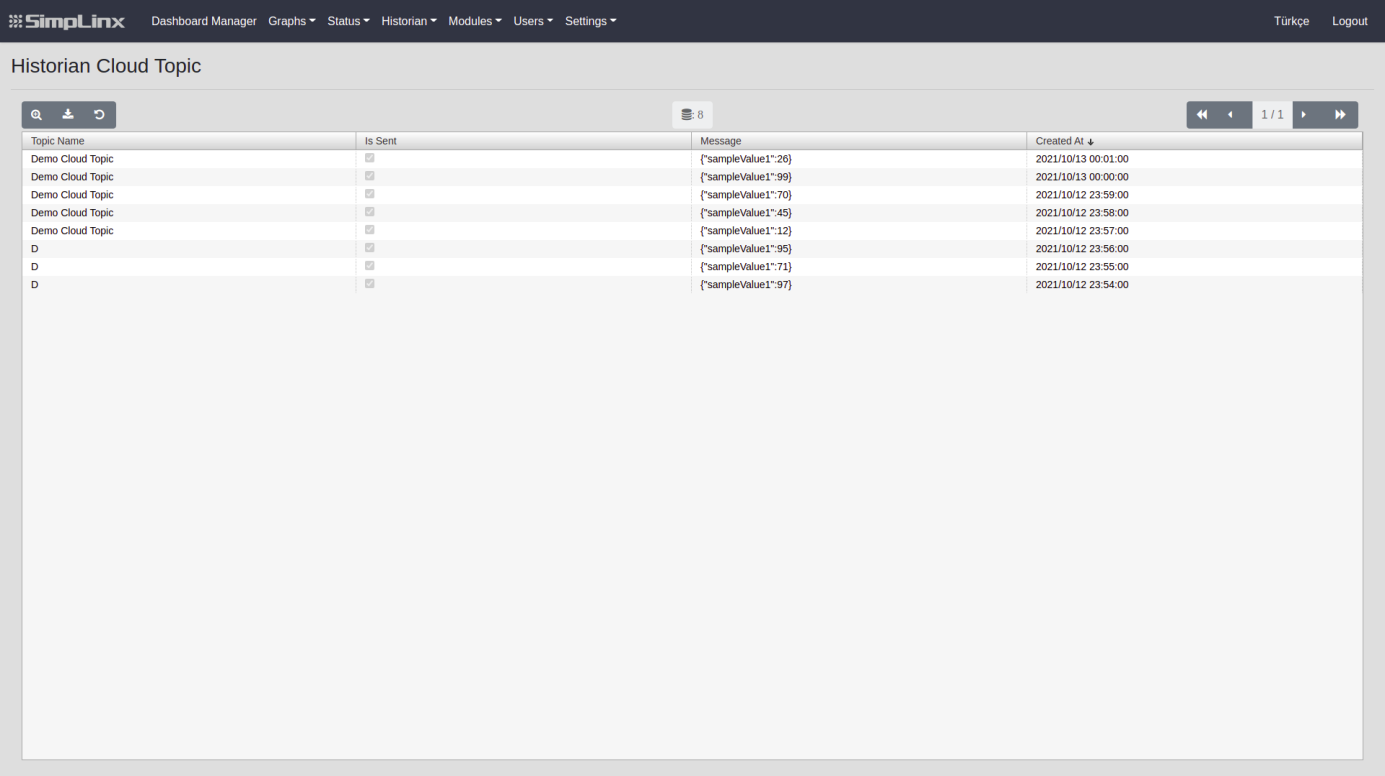
If you wish, you can access the details of the submitted subjects by double clicking the created subject record from the list or by selecting the subject record and clicking the button
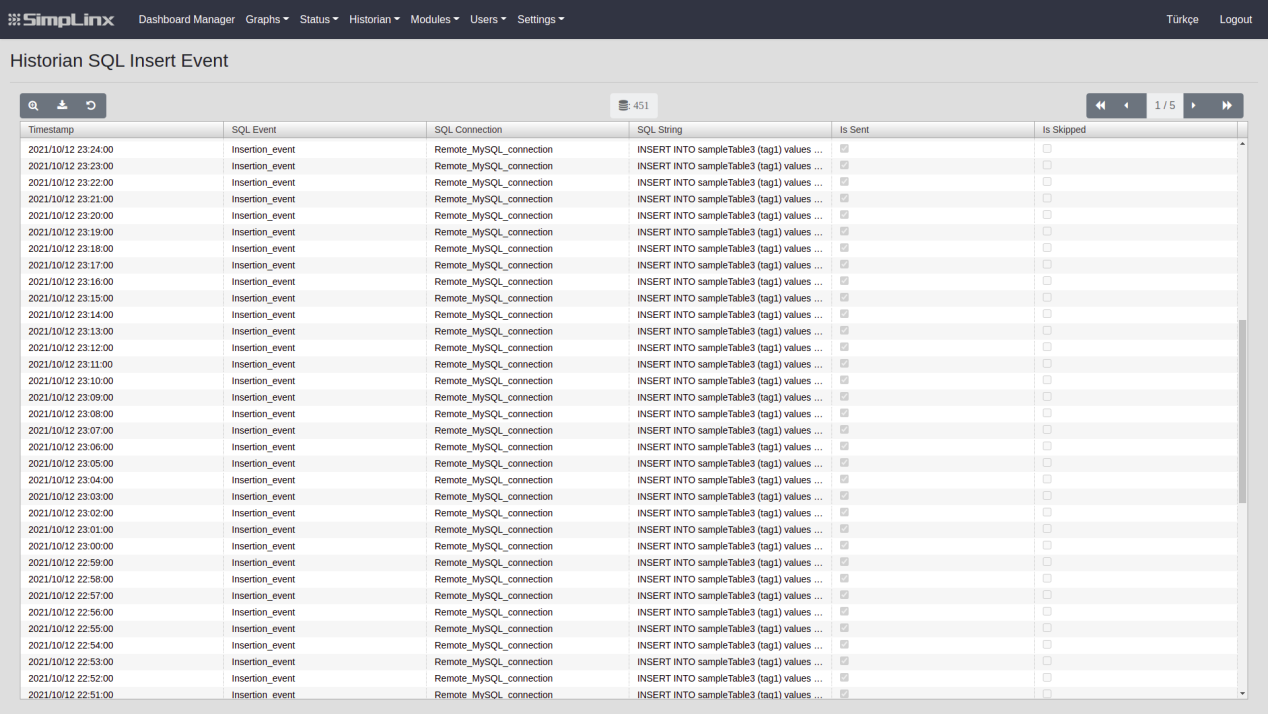
SQL Insert Event
Section titled “SQL Insert Event”On this page, information about the SQL insert events sent when the events are triggered in the records you created on the “Modules”->”SQL Insert Event” page is listed.
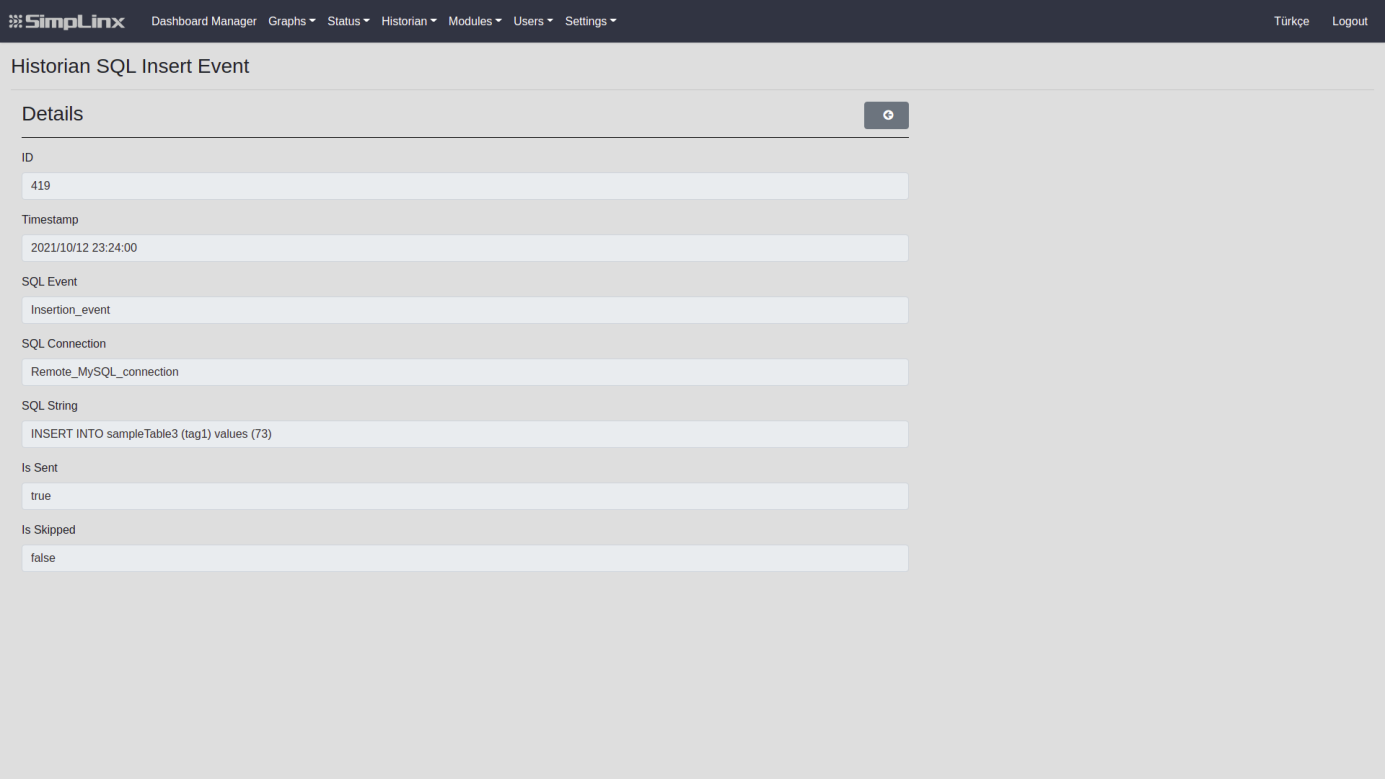
If you wish, you can access the details of the email record by double clicking from the list or by selecting the email record and clicking the button
Modules
Section titled “Modules”This tab contains the pages where the definitions and settings are made that are required for data collection. These pages are accessed only by the admin user. To use data collection, the first to do is make the necessary definitions from the pages under the “Modules” tab. Pages consist of several buttons and data from the table. These are;
- Buttons
 | Used to display data details. Editing cannot be made. |
|---|
 | Used to delete the selected data from the table. |
|---|
- Data
| Shows the page you are in the table and the total number of pages. The table generates 1 page for each 100 data. |
|---|
Driver
Section titled “Driver”The page that you define for data collection is the page where you can list and manage the PLCs you define. If you are logging into the system for the first time, the list will be empty.
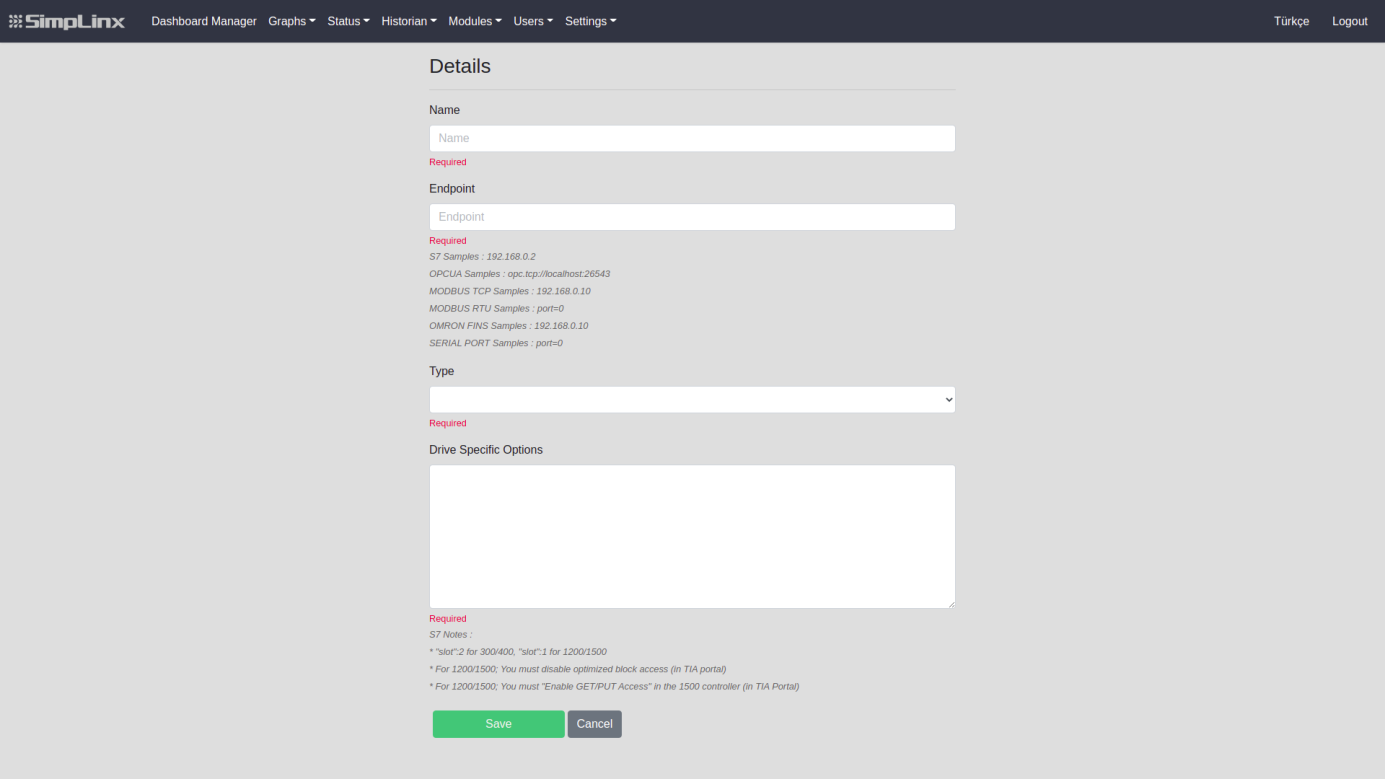
Adding Drive Connection
-
From the Menu, go to the “Modules”--->“Driver” page.
-
Press the icon from Toolbar to +. You will be redirected to the “Add Driver” page. The required information on this page is as follows;
Name: The area you need to easily recognize your driver when performing different operations.
Endpoint: You must enter the IP Address to access your drive connected to SMX-RNS20.
Type: You must select the driver type to adjust the appropriate settings for your drive. The system supports 5 different types of drivers. These are;
-
MODBUS TCP
-
MODBUS RTU
-
OPC UA
-
S7
-
OMRON FINS
-
SERIAL PORT
-
INTERVAL
Drive Specific Settings: This value automatically comes according to the type of driver that you have selected. You can edit additional settings here if you wish.
Once the necessary information is entered, your driver will be identified in the system. To make sure that your settings are correct and the connection is provided, you can go from the menu to the “Status”--->“Driver” tab.
An error may appear during connecting when the status page is first opened. Check again with the Refresh button.
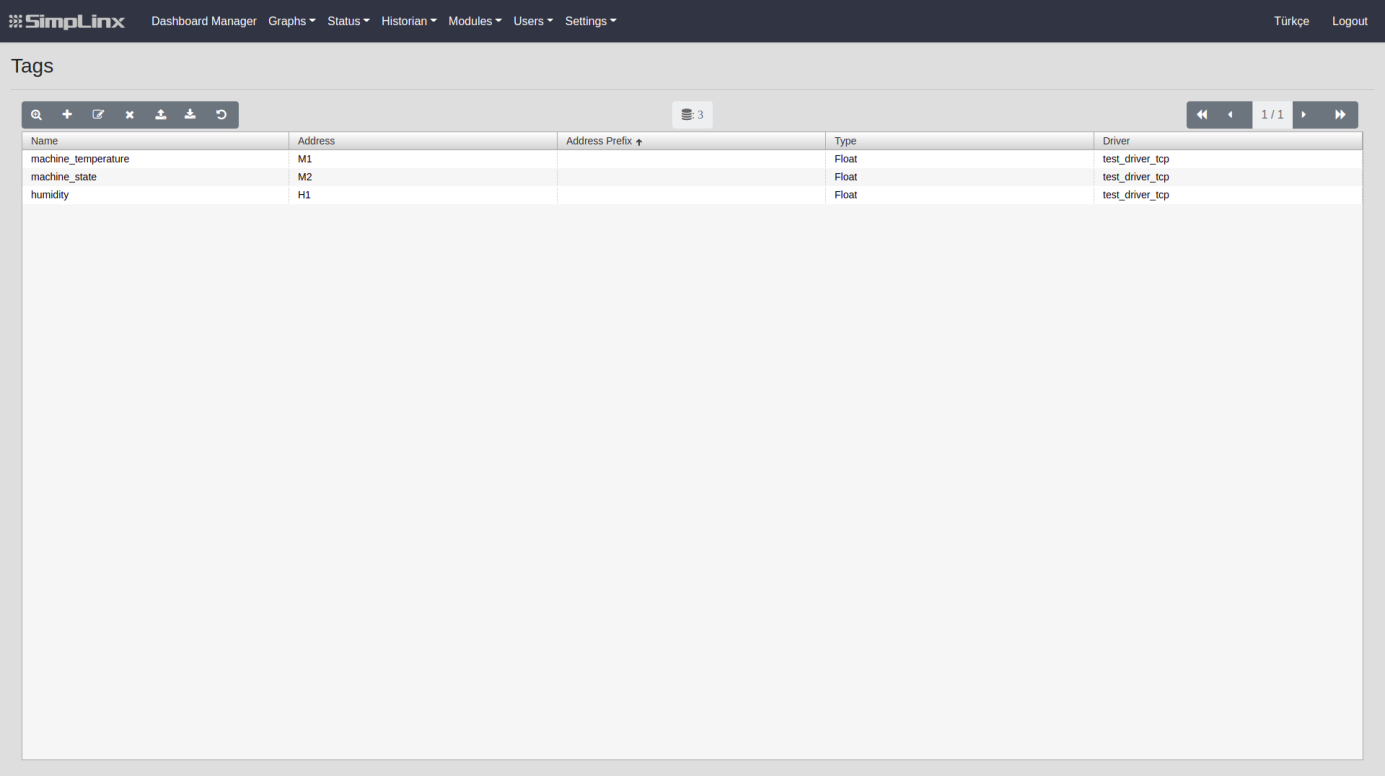
This is the page where tags are listed and managed. If you are logging into the system for the first time, the list will be empty.
Adding Tags
-
From the Menu, go to the “Modules”--->“Tag” page.
-
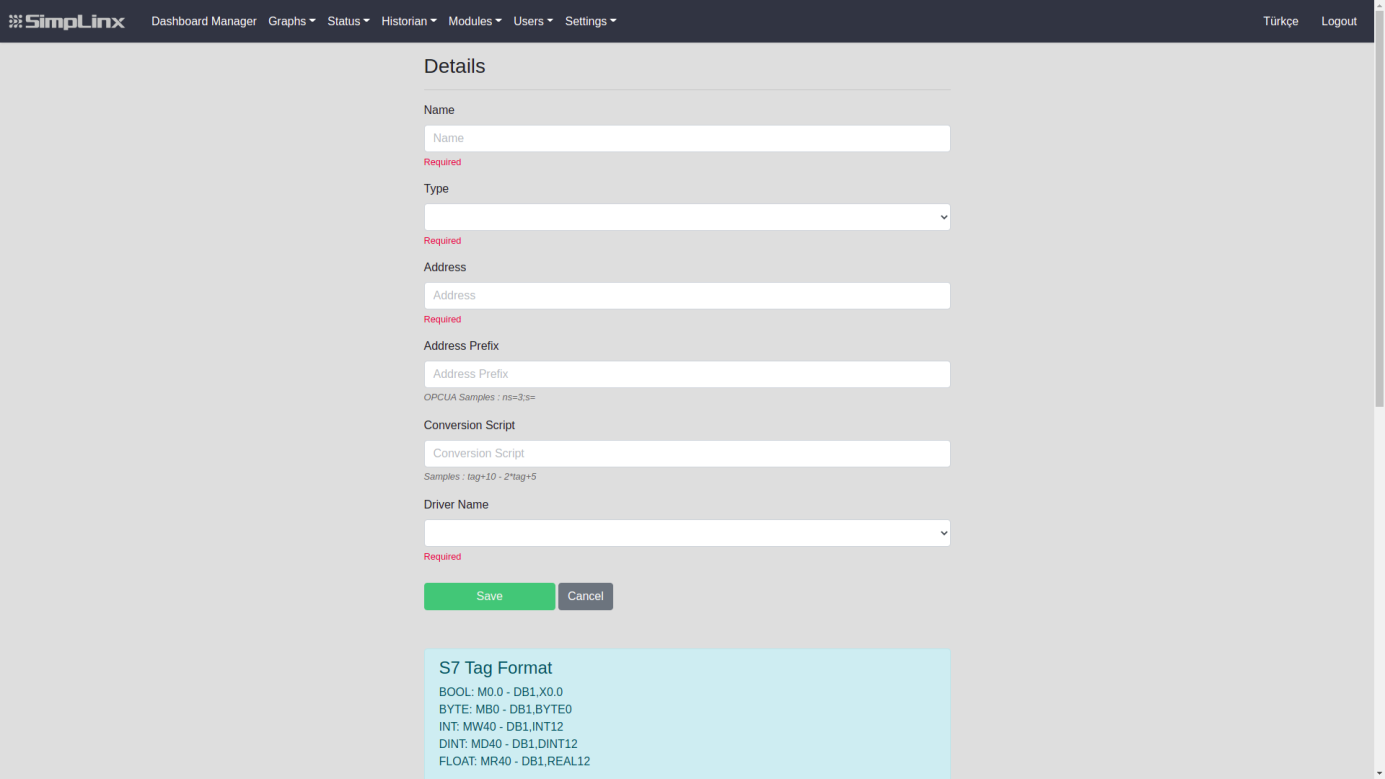
Press the icon from Toolbar to +, you will be redirected to the “Tag Insert” page. The required information on this page is as follows;
Name: The area you need to easily recognize your tag when doing different operations.
Type: You must select the correct data type to read values from the tag
Address: You must enter the address in your PLC to access the relevant tag.
Address Prefix: This is required when reading data from your OPC-UA type drivers. Different types of drivers can be passed blank.
Conversion Script: This is the area where you can use your tag data to save your data by making changes over incoming data without interfering with PLC. Support JavaScript codes.
Driver Name: This is the field where the tag is in which PLC is selected.
Once the necessary information is entered, your tag will be defined in the system. To make sure your settings are correct, you can go to the “Status”--->“Tag” page from the menu.
An error may appear during connecting when the Tag page is first opened. Check again with the Refresh button.
Archive
Section titled “Archive”This is the page where you can list and manage archive settings. Archives ensure that the value of the tag you specify is recorded regularly.
Adding Archives
-
From the Menu, go to “Modules”--->“Archive” page.
-
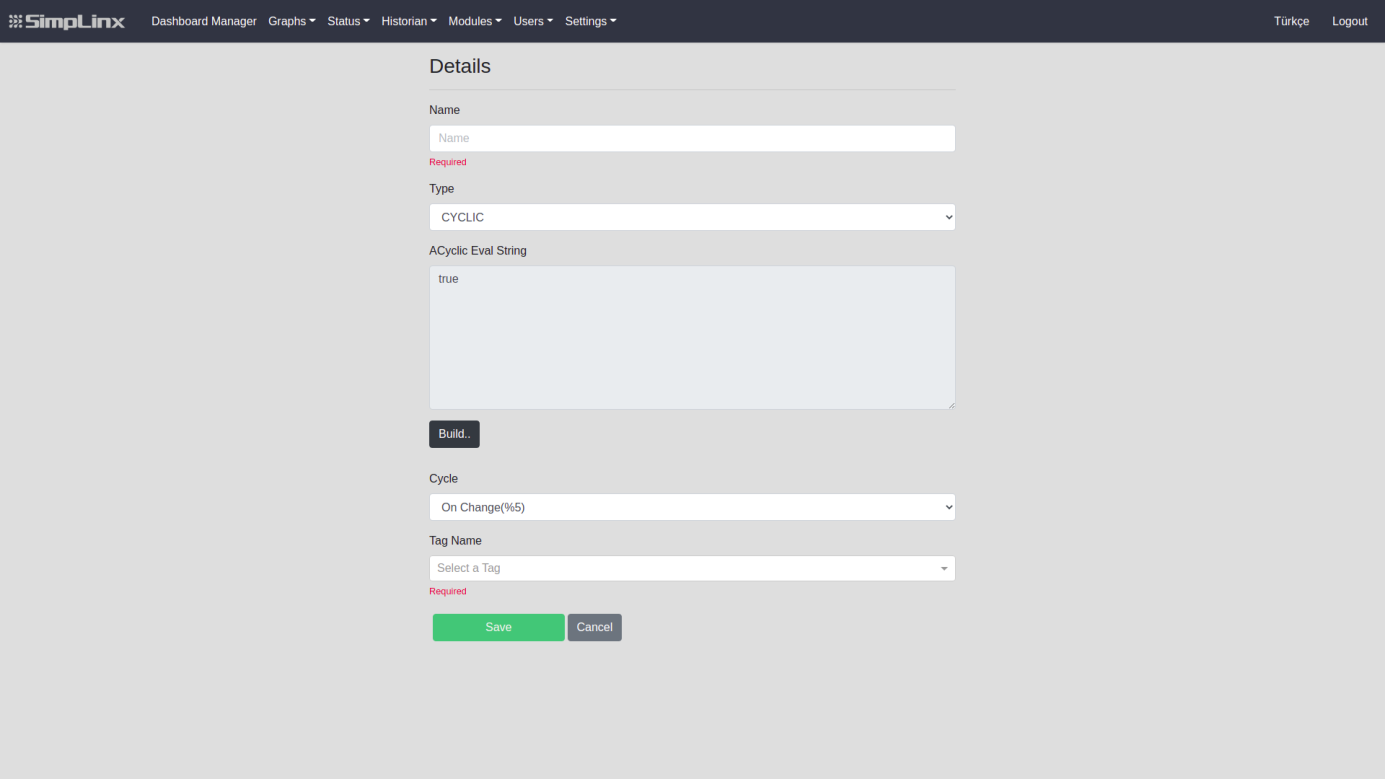
Press the icon from Toolbar to +, you will be redirected to the “Adding Archive” page. The required information on this page is as follows;
Name: The area you need to easily recognize your archives when doing different operations.
Type: Specifies the archive creation type. There are two different options. These are;
- CYCLIC
Allows archive creation with specific loops, such as minutes, hours.
- ACYCLIC
Ensures the creation of one archive each time the specified condition is provided.
ACyclic Eval String: It is active when ACYCLIC is selected as the type. The trigger condition must be written in the specified field by using the CREATE.. button or directly typing. As long as the condition is met, archives are created at 5 seconds interval.
Loop: It is active when CYCLIC is selected as type. It ensured that the relevant archive is created at certain intervals without being bound by any conditions.
Tag Name: Determines the tag to be saved as an archive.
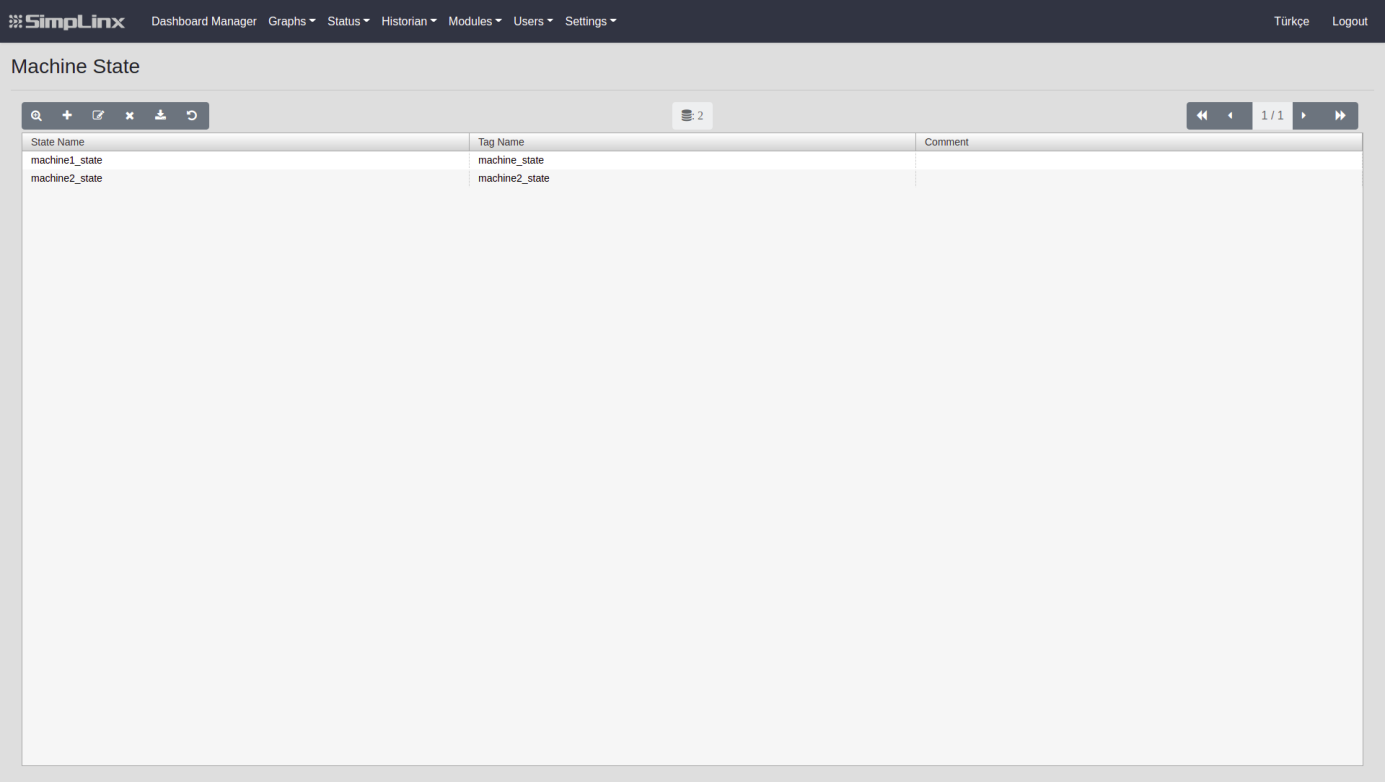
Machine State
Section titled “Machine State”It is the page where the machines to be monitored are listed and you can manage them. If you add a tag with your machine status to your PLC, the values on that tag are recorded according to the standard. Thanks to the machine status, you can monitor the momentary or retrospective status of your machine at what time. There are 17 different machine states. Each case is shown with different standardized colors. The values and meanings of these colors are specified at the bottom of the page. For more information, please follow the relevant link.
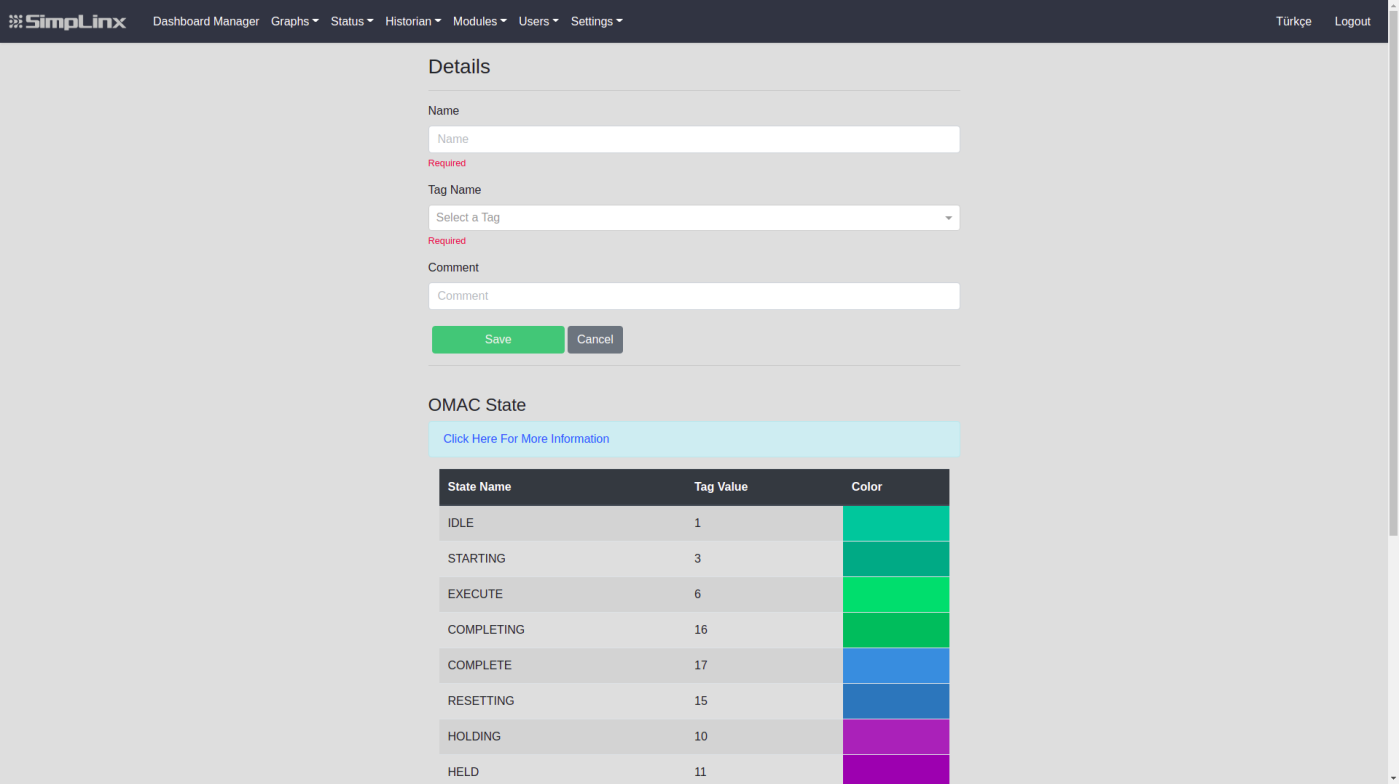
Adding Machine States
-
From the Menu, go to the “Modules”--->“Machine State” page.
-
Press the icon from Toolbar to +, you will be redirected to the “Adding Machine State” page. The required information on this page is as follows;
Name: The area you need to easily recognize your machine status when performing different operations.
Tag Name: The area where the Tag with machine status information is selected.
Comment: A comment can be added to provide information about the machine status created. It is not mandatory, it can be left blank.
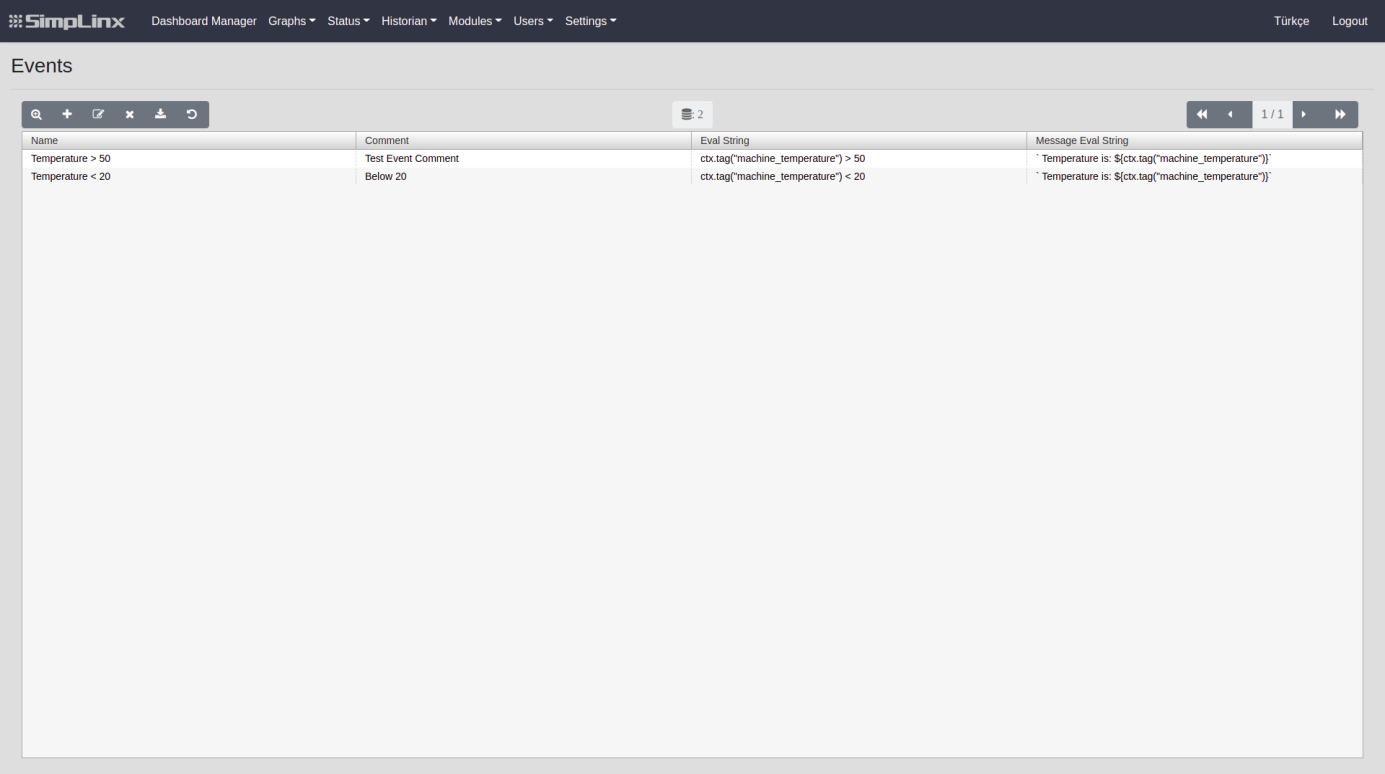
The page where you can list and manage events created. Events occur when the conditions of the tag you set are met. The events you create will allow you to be notified by email or SMS.
Adding Events
-
From the Menu, go to the “Modules”--->“Event” page.
-
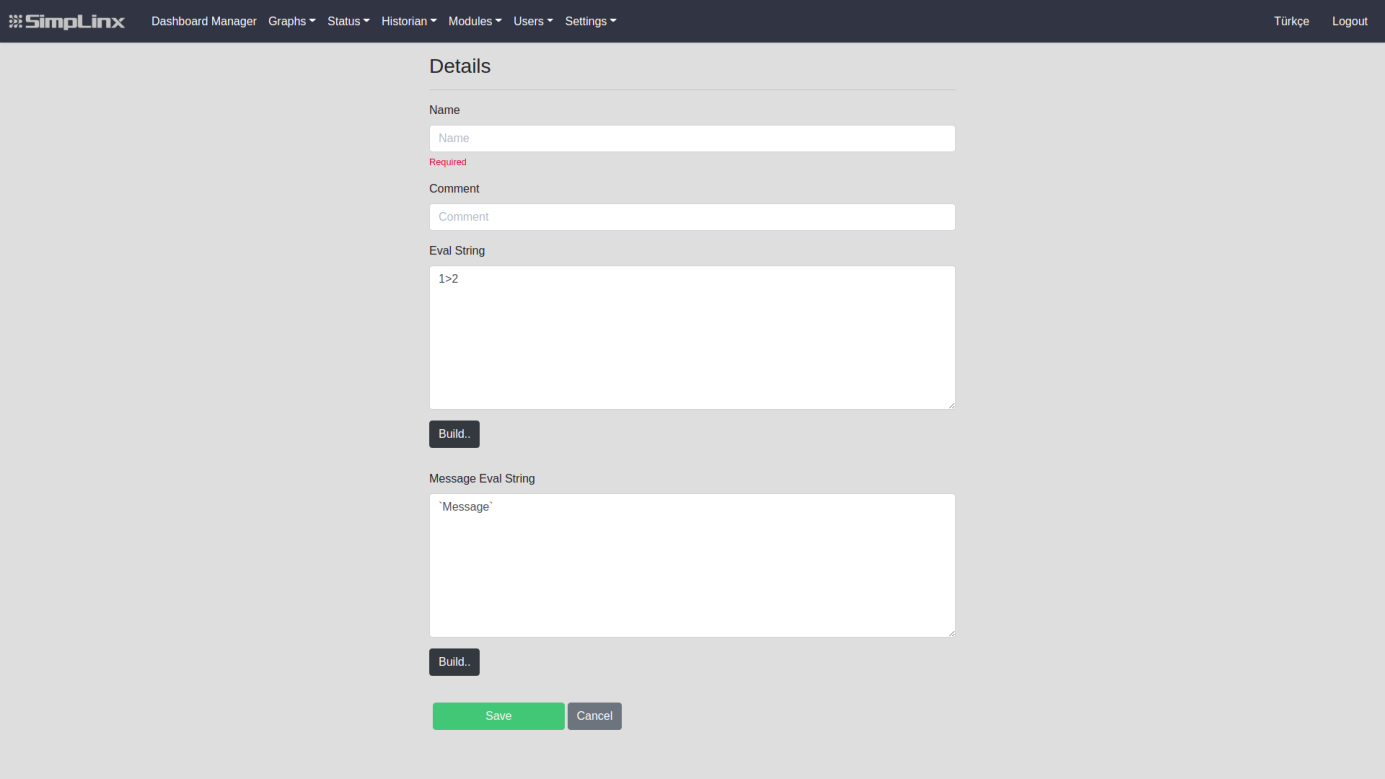
Press the icon from Toolbar to +, you will be redirected to the “Adding Event” page. The required information on this page is as follows;
Name: The area that you need to easily recognize when doing different operations.
Comment: A comment can be added to provide information about the event created. It is not mandatory, it can be left blank.
Eval String: Create in the specified field the trigger condition must be written by typing or the button directly. The event will be created as the condition is provided.
Message Eval String: Create in the specified field the message to be saved can be written when creating an event by button or directly typing. This message value is used as message content in email and SMS submission.
For example, if the event creation depends on a specific tag, the message section can also indicate that tag and print the value of the tag when the event is created.
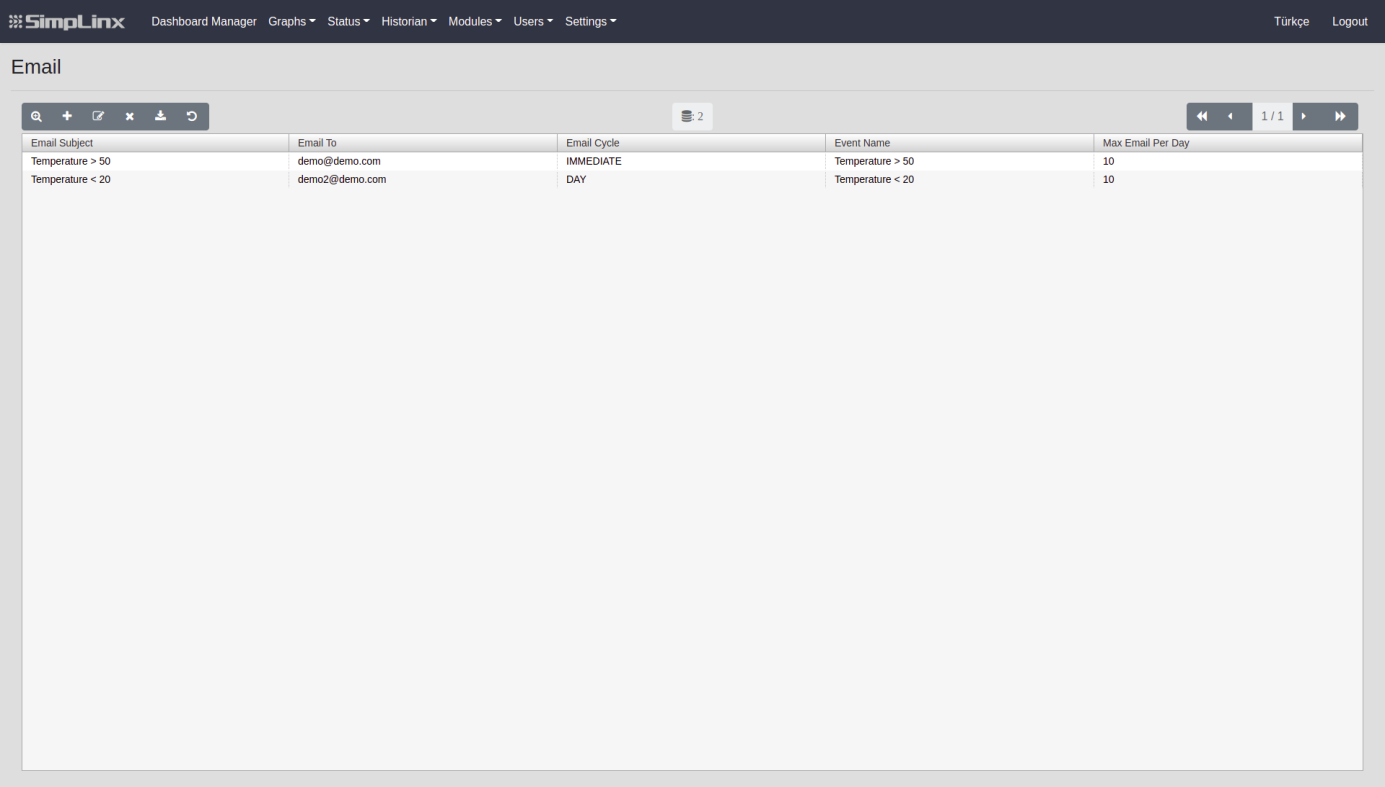
It is the page where email settings are listed and managed. Depending on the events you create, it allows you to learn about the situation. When the events are triggered, information mail is sent to you according to the cycle you have determined.
Adding Emails
-
From the Menu, go to the “Modules”--->“Email” page.
-
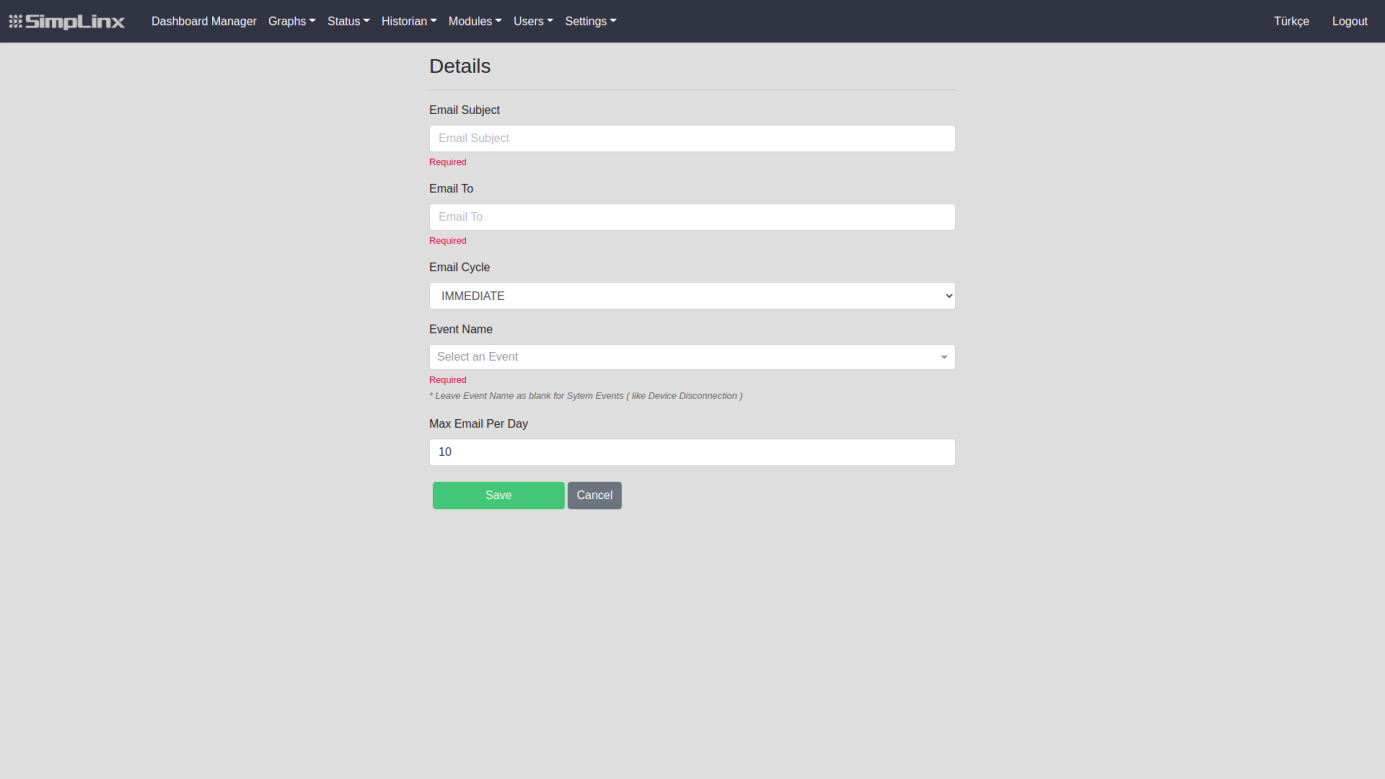
Press the icon from Toolbar to +, you will be redirected to the “Adding An Email ” page. The required information on this page is as follows;
Email Subject: The area that determines the subject in the mail sent.
Email To : The area where it is determined who to go to mail when the relevant event is triggered.
Email Cycle: The area that determines the frequency of mail sent as the event is triggered. If you wish, you can send an e-mail at the time the event occurs, or if you want to collect events daily or weekly and send them as mail.
Event Name: The field in which the event name to follow is selected. As the event unfolds, the message you set up in event details will be delivered to you according to the mail cycle.
Max Email Per Day: The area where the mail limit to be sent to you daily is determined. In some cases, it is used because the event occurs very often, the mail comes in and there is a pile-up.
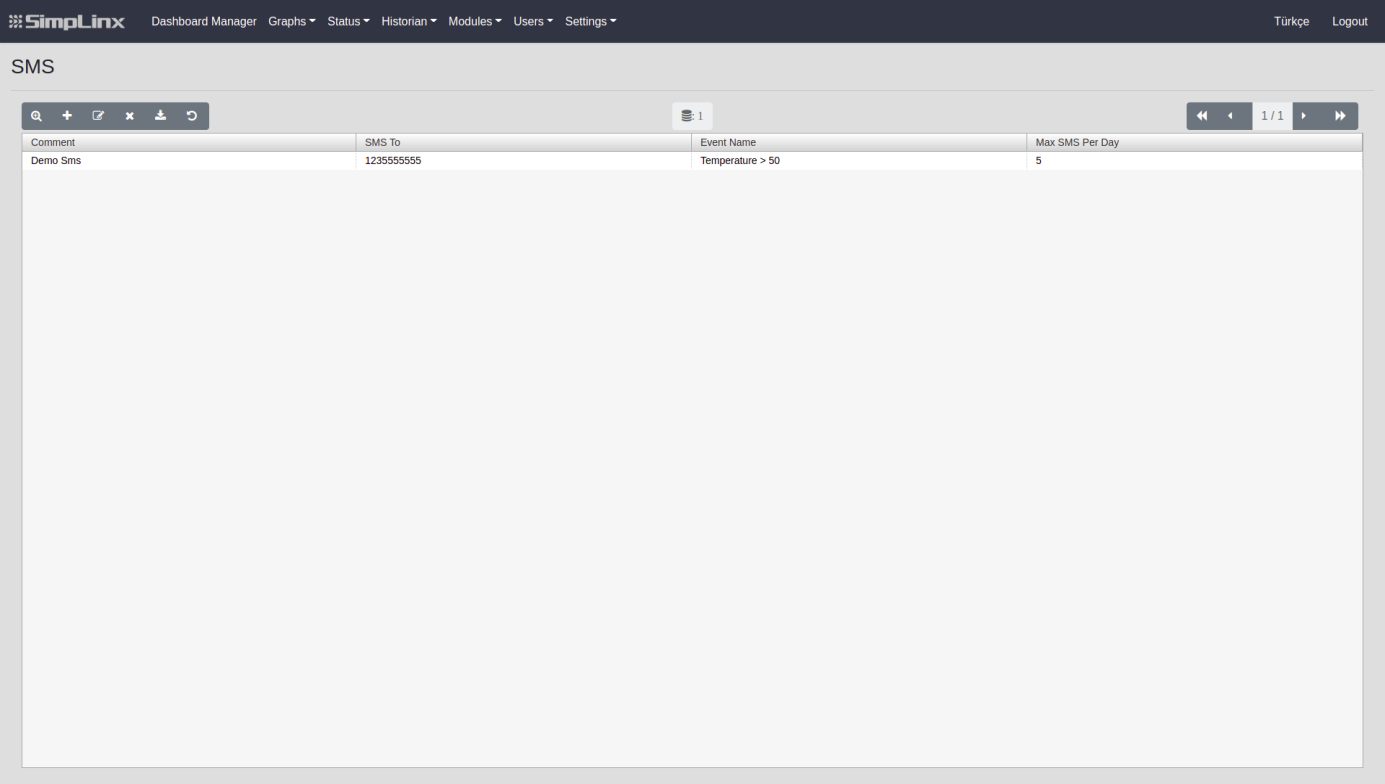
This is the page where SMS settings are listed and managed. Depending on the events you create, it allows you to learn about the situation. When events are triggered, the information SMS is sent to the person you specified.
Adding SMS Configuration
-
From the Menu, go to the “Modules”--->“SMS” page.
-
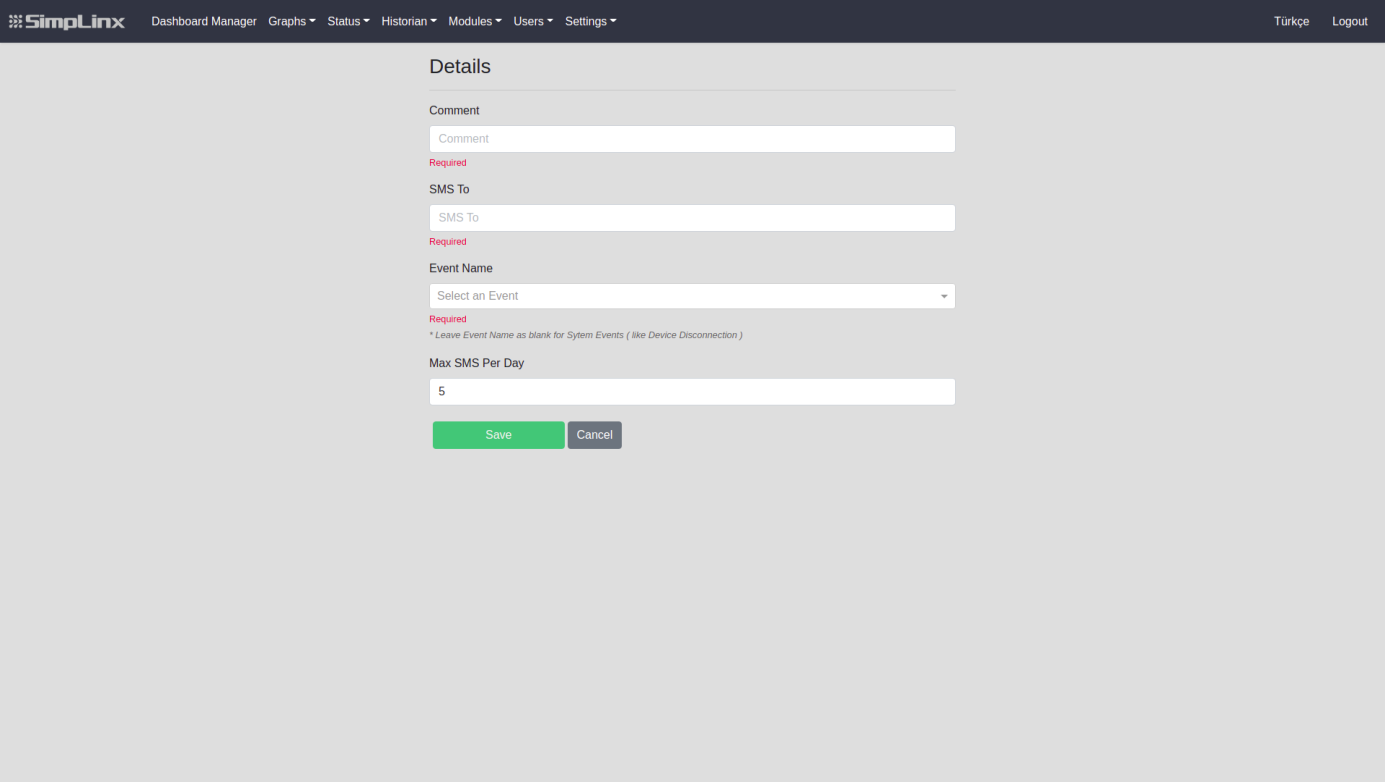
Press the icon from Toolbar to +, you will be redirected to the “Adding SMS” page. The required information on this page is as follows;
Comment: A comment must be added to provide information about the generated SMS setting.
SMS To: It is the area where it is determined to which number the SMS will go when the relevant event is triggered.
Event Name: The field where the event name to follow is selected. As the event unfolds, the message you set up in event details will be transmitted to you as SMS.
Max SMS Per Day: The area where the SMS limit to be sent to you daily is determined. In some cases, it is used because events occur frequently and mail is received.
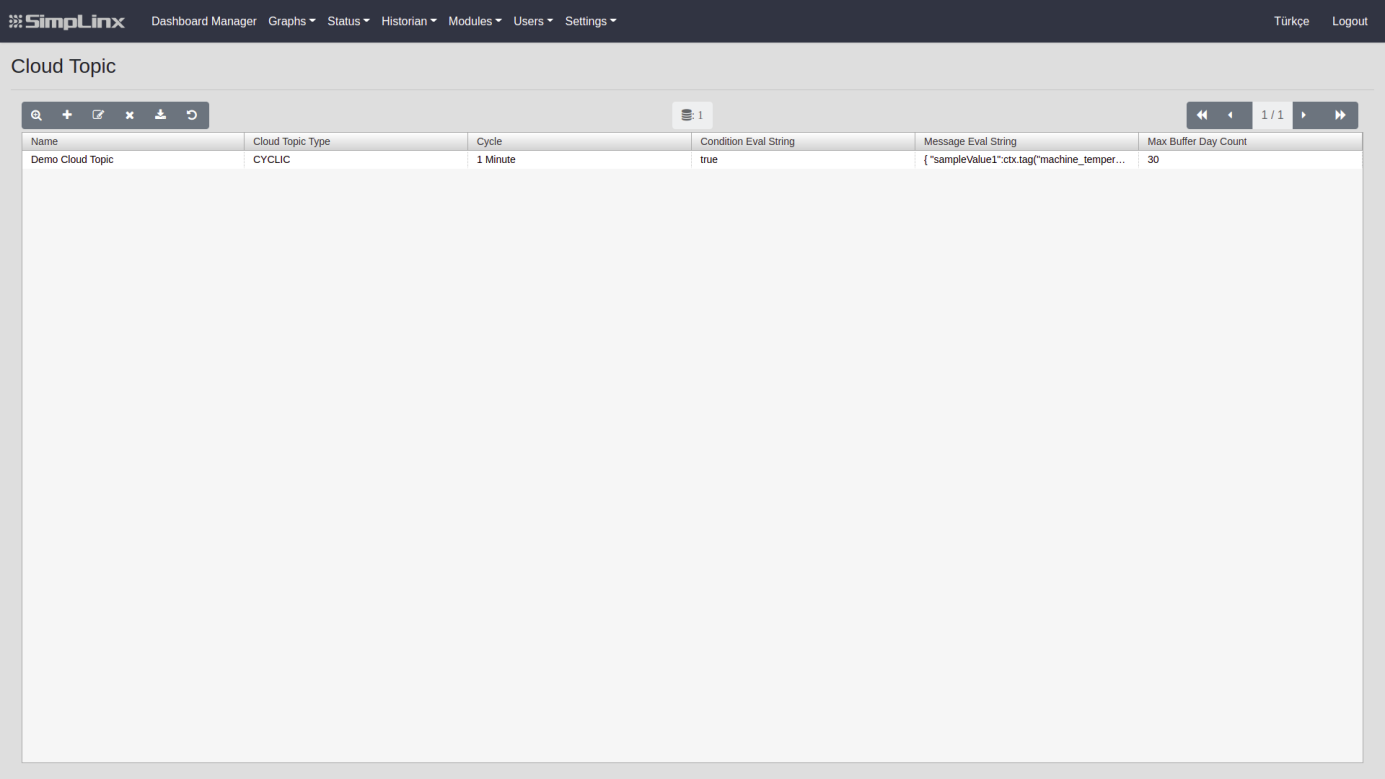
Cloud Topic
Section titled “Cloud Topic”A page where preset Cloud Topic values are listed and managed. According to the values set here, the data is written to the cloud server..
Adding Cloud Topic
-
From the Menu, go to the “Modules”--->“Cloud Topic” page.
-
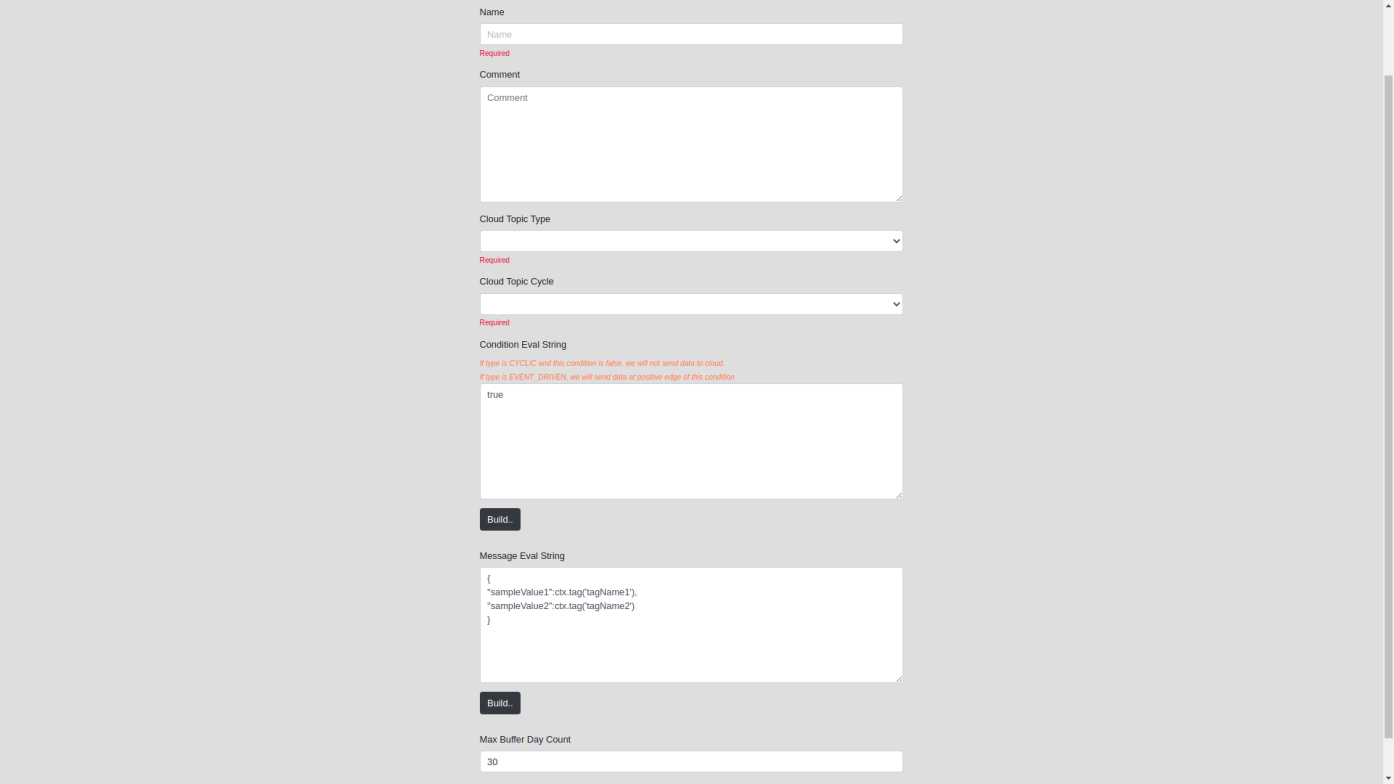
Press the icon from Toolbar to +, you will be redirected to the “Adding Cloud Topic” page. The required information on this page is as follows;
Name: The area you need to easily recognize cloud topic when doing different operations.
Comment: A comment can be added to provide information about the cloud topic created. It is not mandatory, it can be left blank.
Cloud Topic Type: Specifies the type of Cloud Topic creation. These are;
- CYCLIC
Provides cloud topic creation with specific loops, such as minutes and hours.
- EVENT_DRIVEN
Allows the creation of one cloud topic each time the specified condition is provided.
Cloud Topic Cycle: Allows the relevant cloud topic to be created periodically, regardless of any circumstances.
If the Condition Eval String: Cloud Topic Type is CYCLIC and this condition is incorrect, data is not sent to the cloud, but if the type Is Event Oriented, data is sent to the cloud with 5sec. intervals as long as it is provided.
Message Eval String: The area where the message to be saved as data content is specified when sending data to the cloud.
Max Buffer Day Count: Specifies how many days the data to be sent will be stored in the memory in case the connection with the Cloud is lost. Pending data is sent collectively when reconnected. Thus, data loss is prevented.
SQL Insert Event
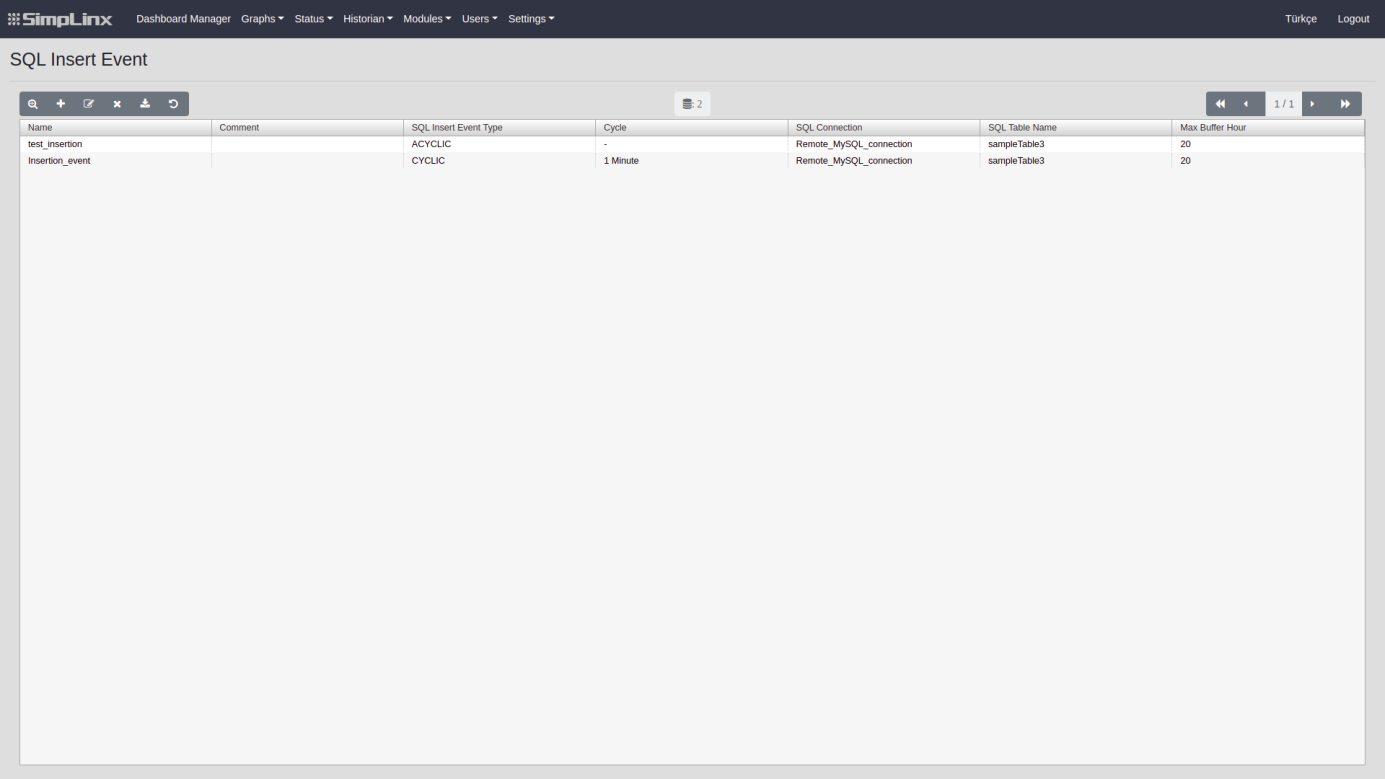
Section titled “SQL Insert Event”This is the page where SQL Insert Events are listed and managed. You can create new events for insertion to remote SQL connections.
Adding SQL Insert Event:
-
From the Menu, go to the “Modules”--->“SQL Insert Event” page.
-
Press the icon from Toolbar to +, you will be redirected to the “Adding SQL Insert Event” page. The required information on this page is as follows;
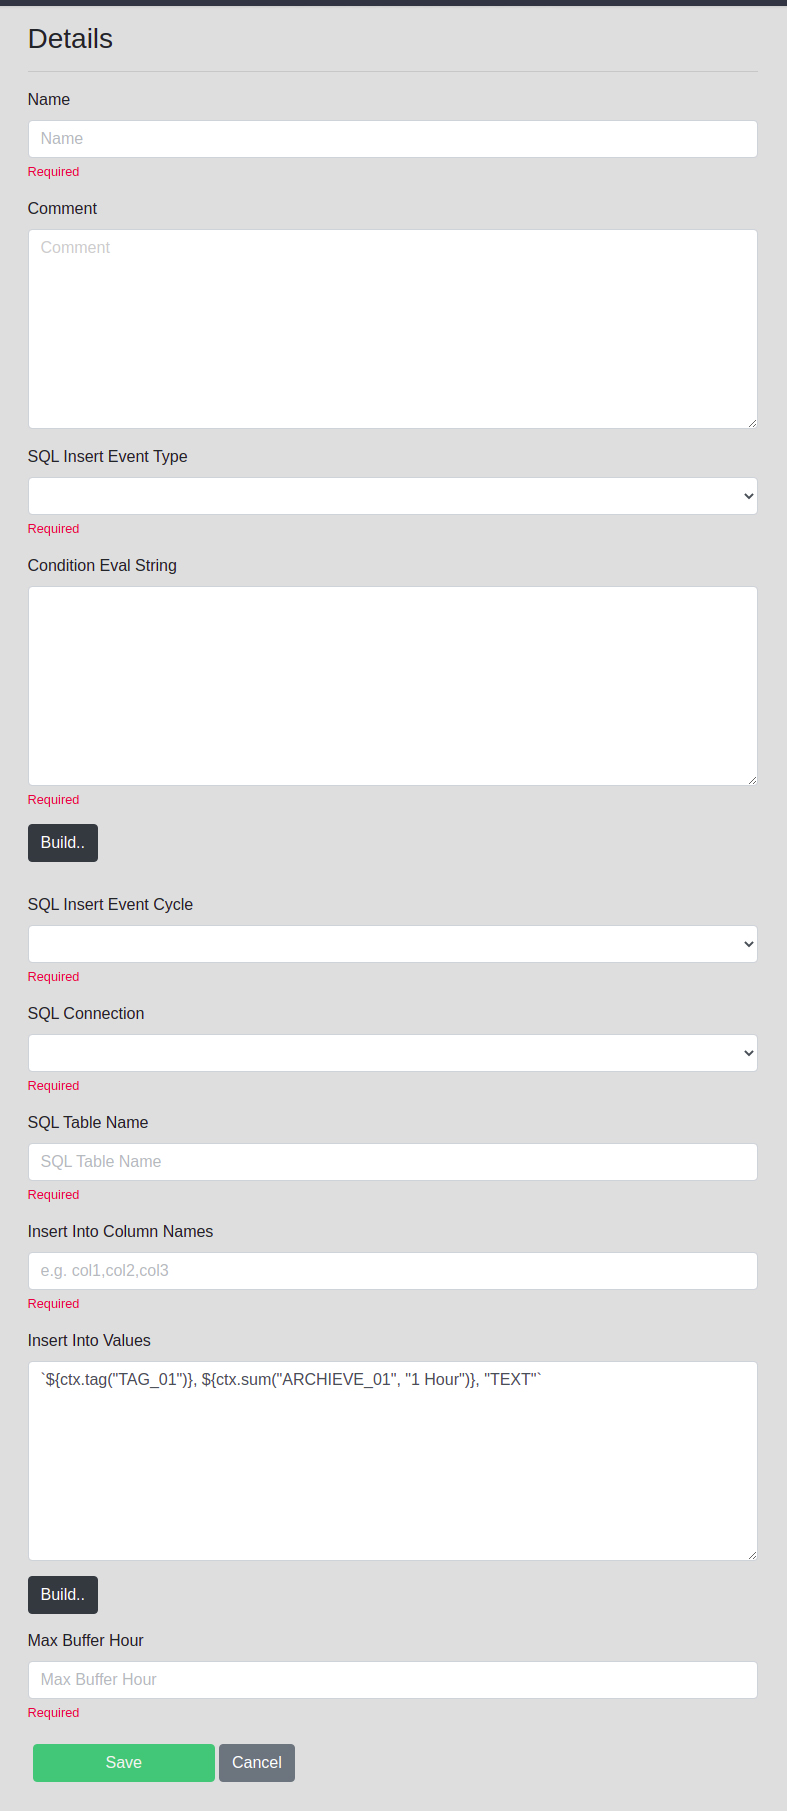
Name: Write any name that you like to describe SQL Insert Event.
Comment: A comment can be added to provide information about the SQL Insert Event created. It is not mandatory, it can be left blank.
SQL Insert Event Type: Specifies the type of SQL Insert Event creation. These are;
- CYCLIC
Provides SQL Insert Event creation with specific loops, such as minutes and hours.
- ACYCLIC
Allows the creation event each time the specified condition is provided.
Condition Eval String: Write your conditional eval string. ACYCLIC events depends “Condition Eval String”. Every change from false to true in this condition, a new insertion event will be created. If your event type is CYCLIC, this area will be empty.
SQL Insert Event Cycle: If your event type is CYCLIC, you have to choose a cycle for events. Cyclic events are created continuously with the selected time interval.
SQL Connection: Choose proper connection which is created in “Settings” page for event.
SQL Table Name: Your table name that you want to insert events.
Insert Into Column Names: Columns that will be effected insertion, you should write column names in order
Insert Into Values: This part should be match with columns that you write above, you can use tag values or any value for column that will be accepted for insertion.
Max Buffer Hour: Specifies how many hours the data to be sent will be stored in the memory in case the connection with the SQL is lost. Pending data is sent collectively when reconnected. Thus, data loss is prevented.
This tab contains pages that are accessible only to the admin user and where users are created and giving permission to access modules.
User Page
Section titled “User Page”This is the page where “Users” are listed and managed. You can create new users, delete users or update users.
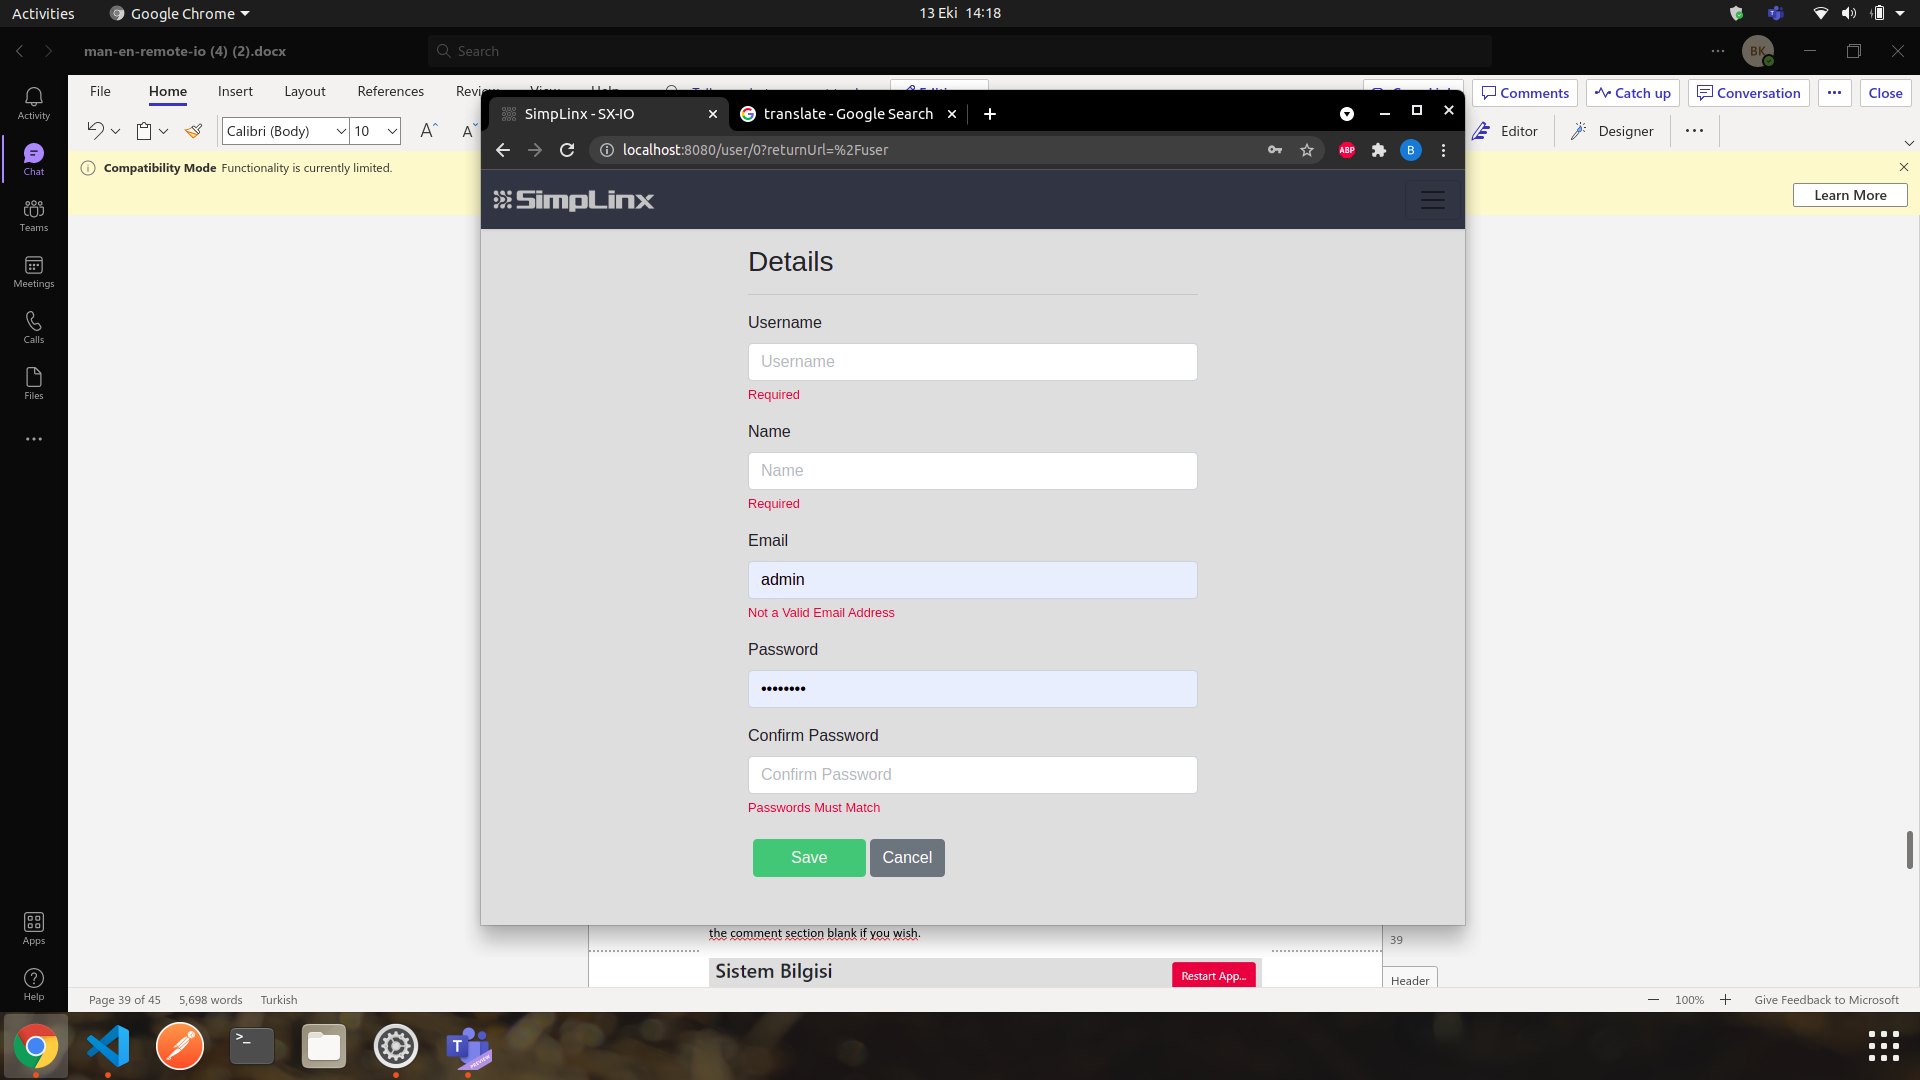
Adding New User:
-
From the Menu, go to the “Users”--->“User” page.
-
Press the icon from Toolbar to +, you will be redirected to the “Details” page. The required information on this page is as follows;
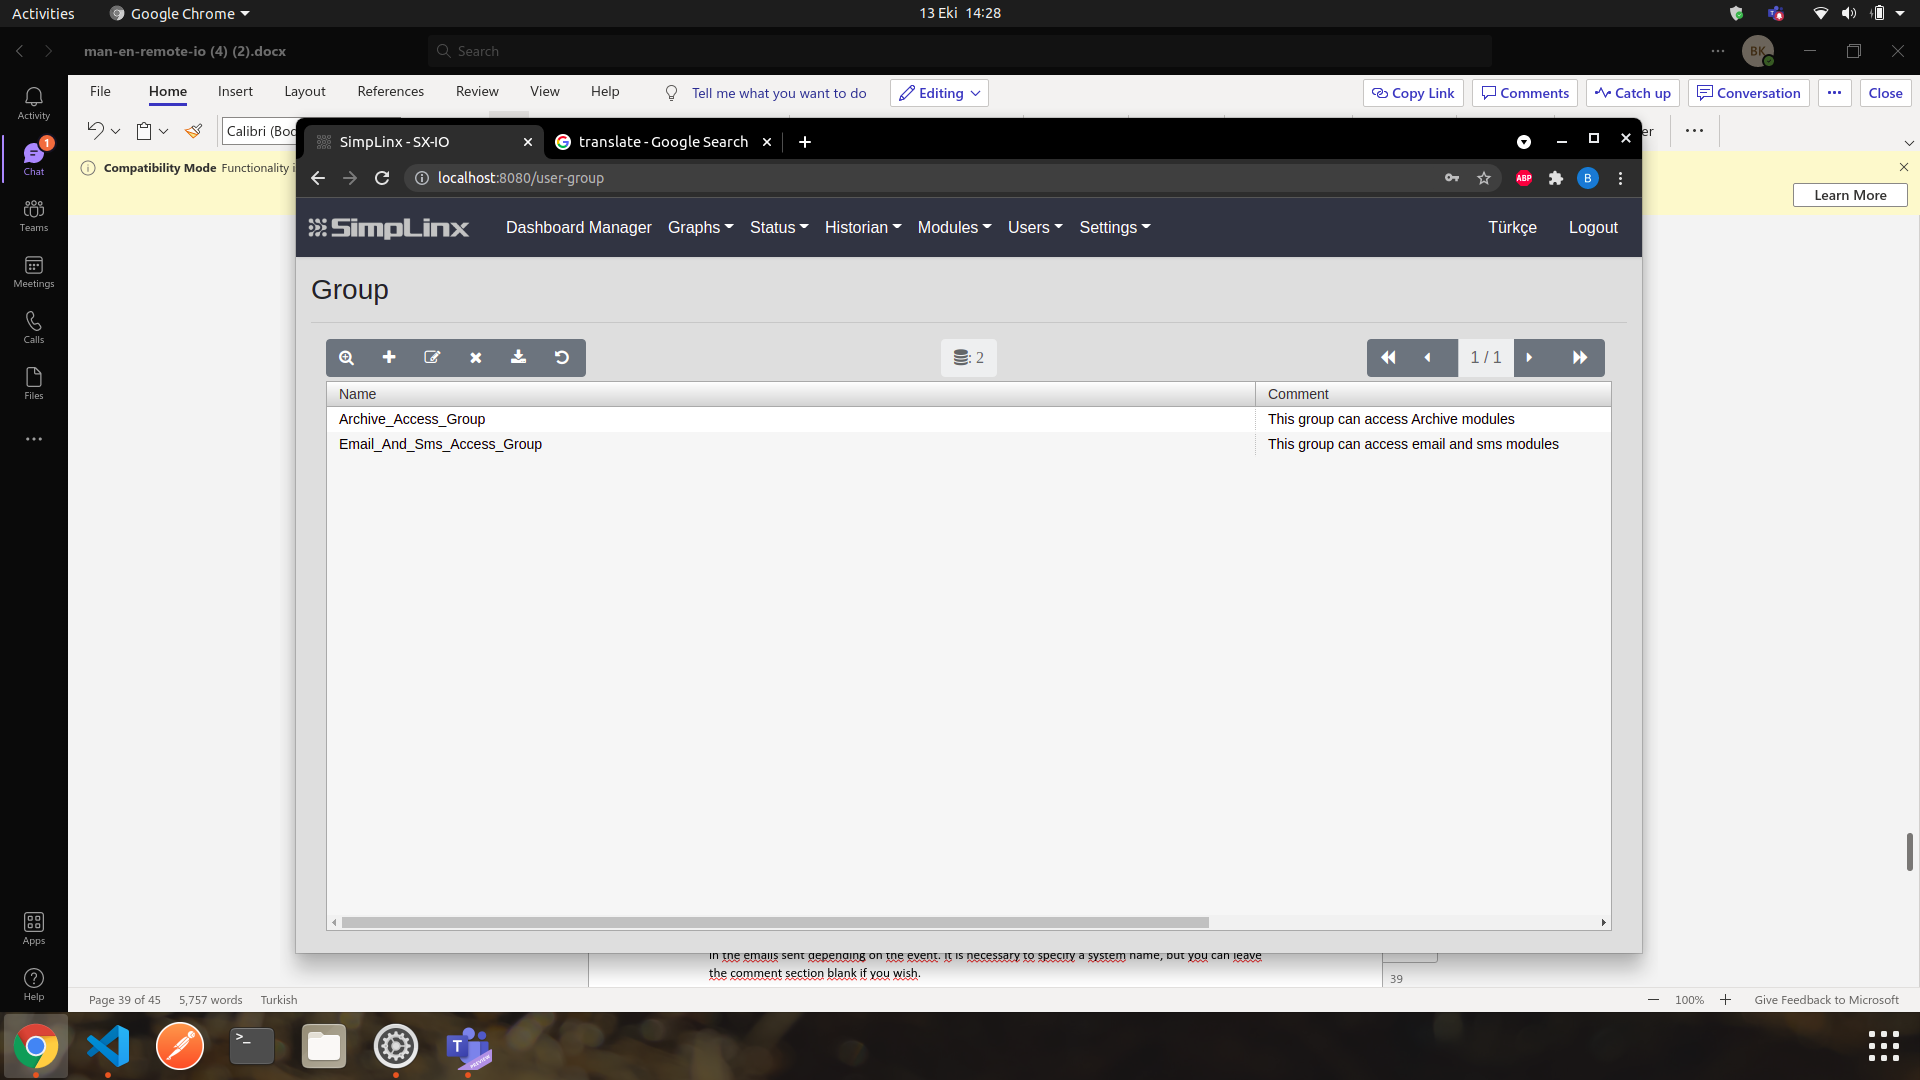
Username: The area where the username is determined for log into the system. Username must be unique.
Name: The area where the name is determined for user.
Email: The area where the email is determined for user.
Password: The area where the password is defined for user.
Confirm Password: The area where the password should be match from above.
Group Page
Section titled “Group Page”This is the page where “Group” are listed and managed. You can create new group, delete group or update group.
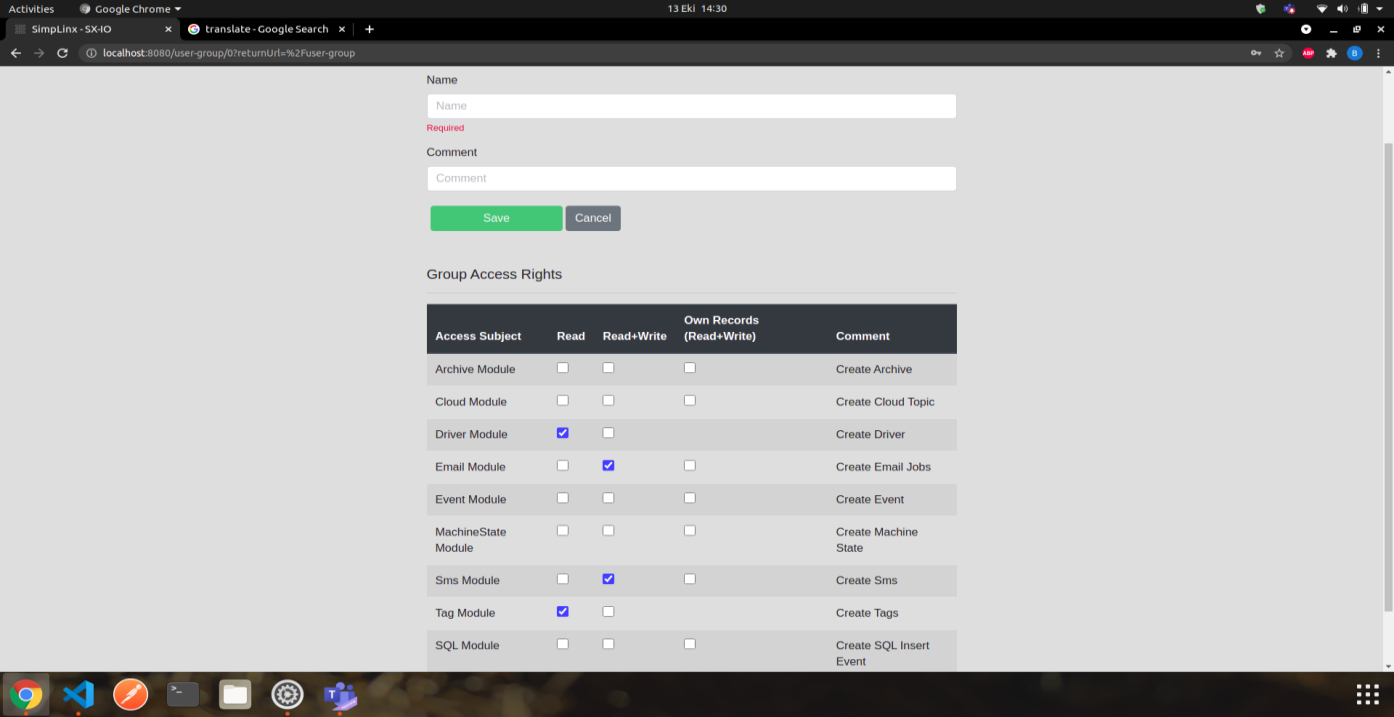
Adding New Group:
-
From the Menu, go to the “Users”--->“Group” page.
-
Press the icon from Toolbar to +, you will be redirected to the “Details” page. The required information on this page is as follows;
Name: The area where the name is determined for group.
Comment: A comment can be added to provide information about the group created. It is not mandatory, it can be left blank.
Group Access Rights: The area where the access rights are determined for group.
“Read” access for only viewing data from that module.
“Read + Write” access for viewing or dealing with data from that module.
“Own Recods(Read + Write)” access for viewing or dealing with data which is created by current user.
Mapping Page
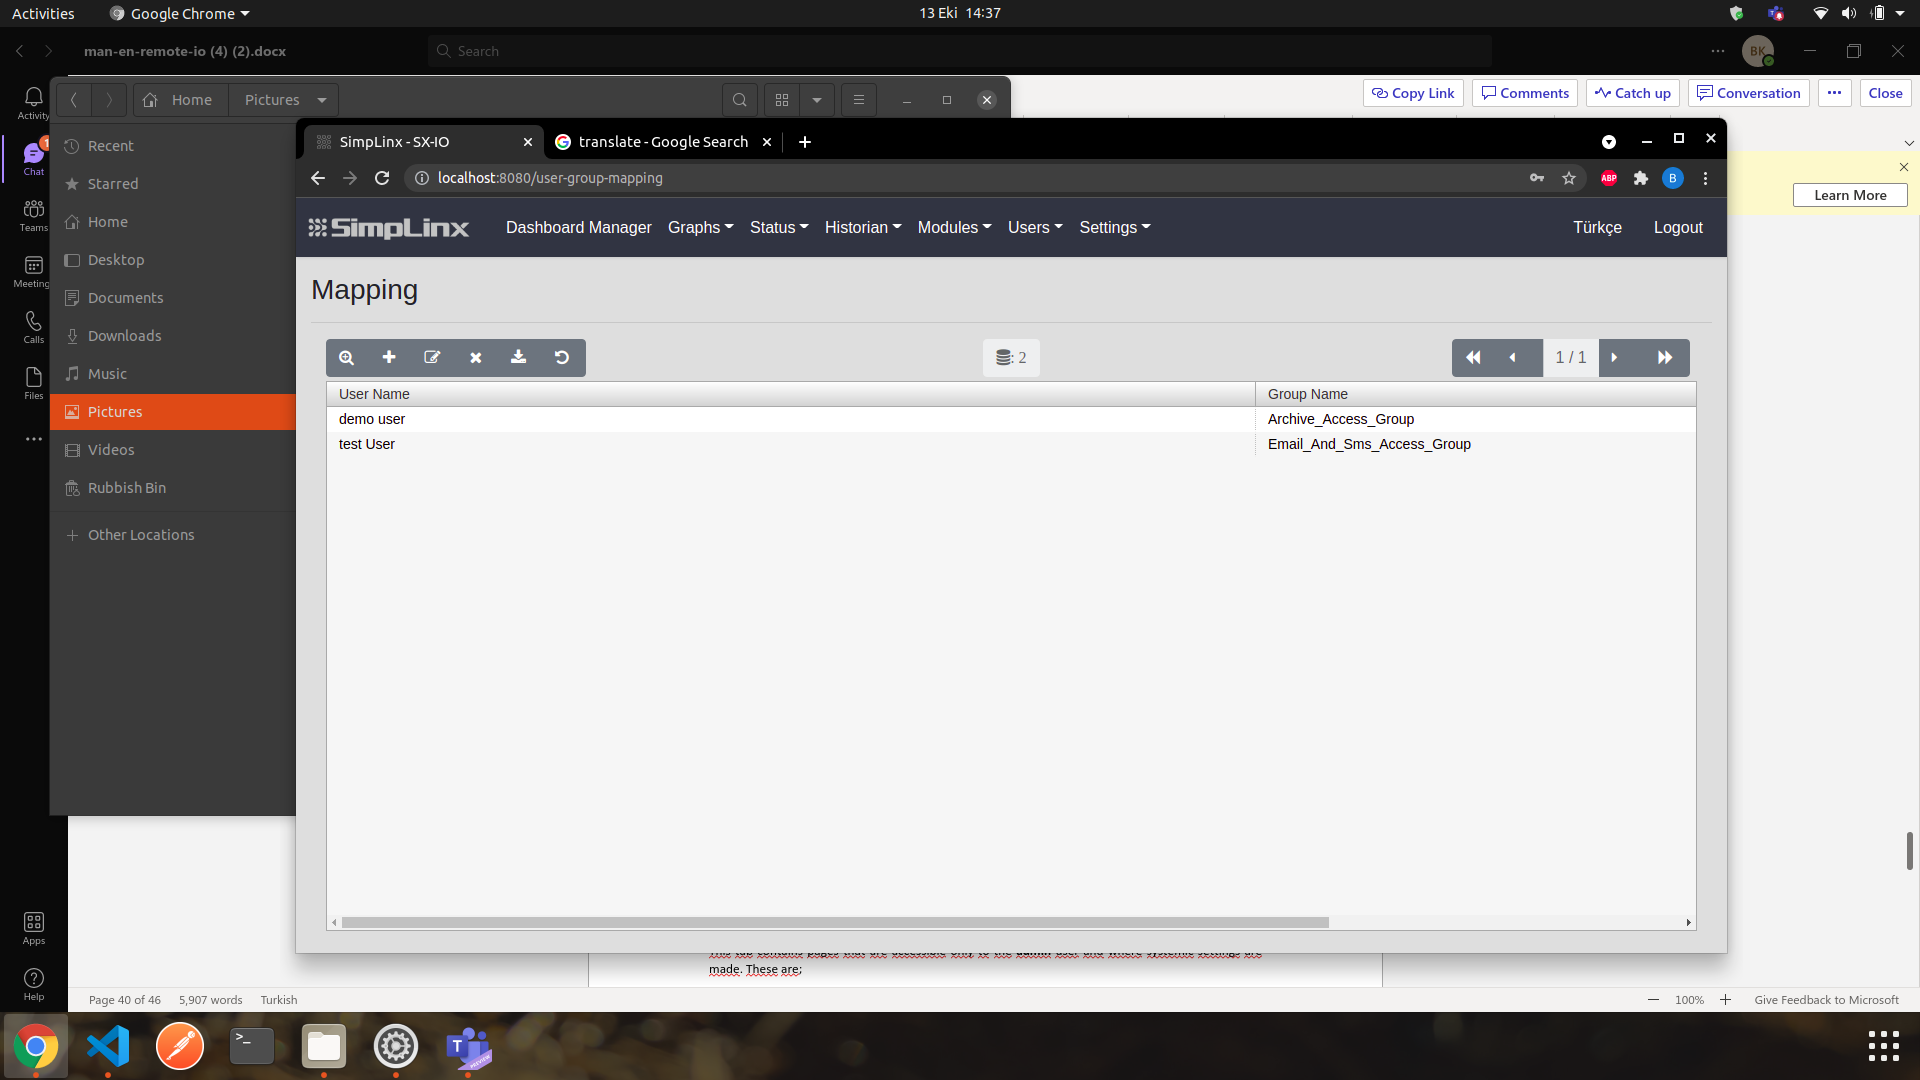
Section titled “Mapping Page”This is the page where “Mapping” are listed and managed. You can create new mapping, delete mapping or update mapping. When you create new mapping for user and a group, user have access for modules which are described in that group.
Adding New Mapping:
-
From the Menu, go to the “Users”--->“Mapping” page.
-
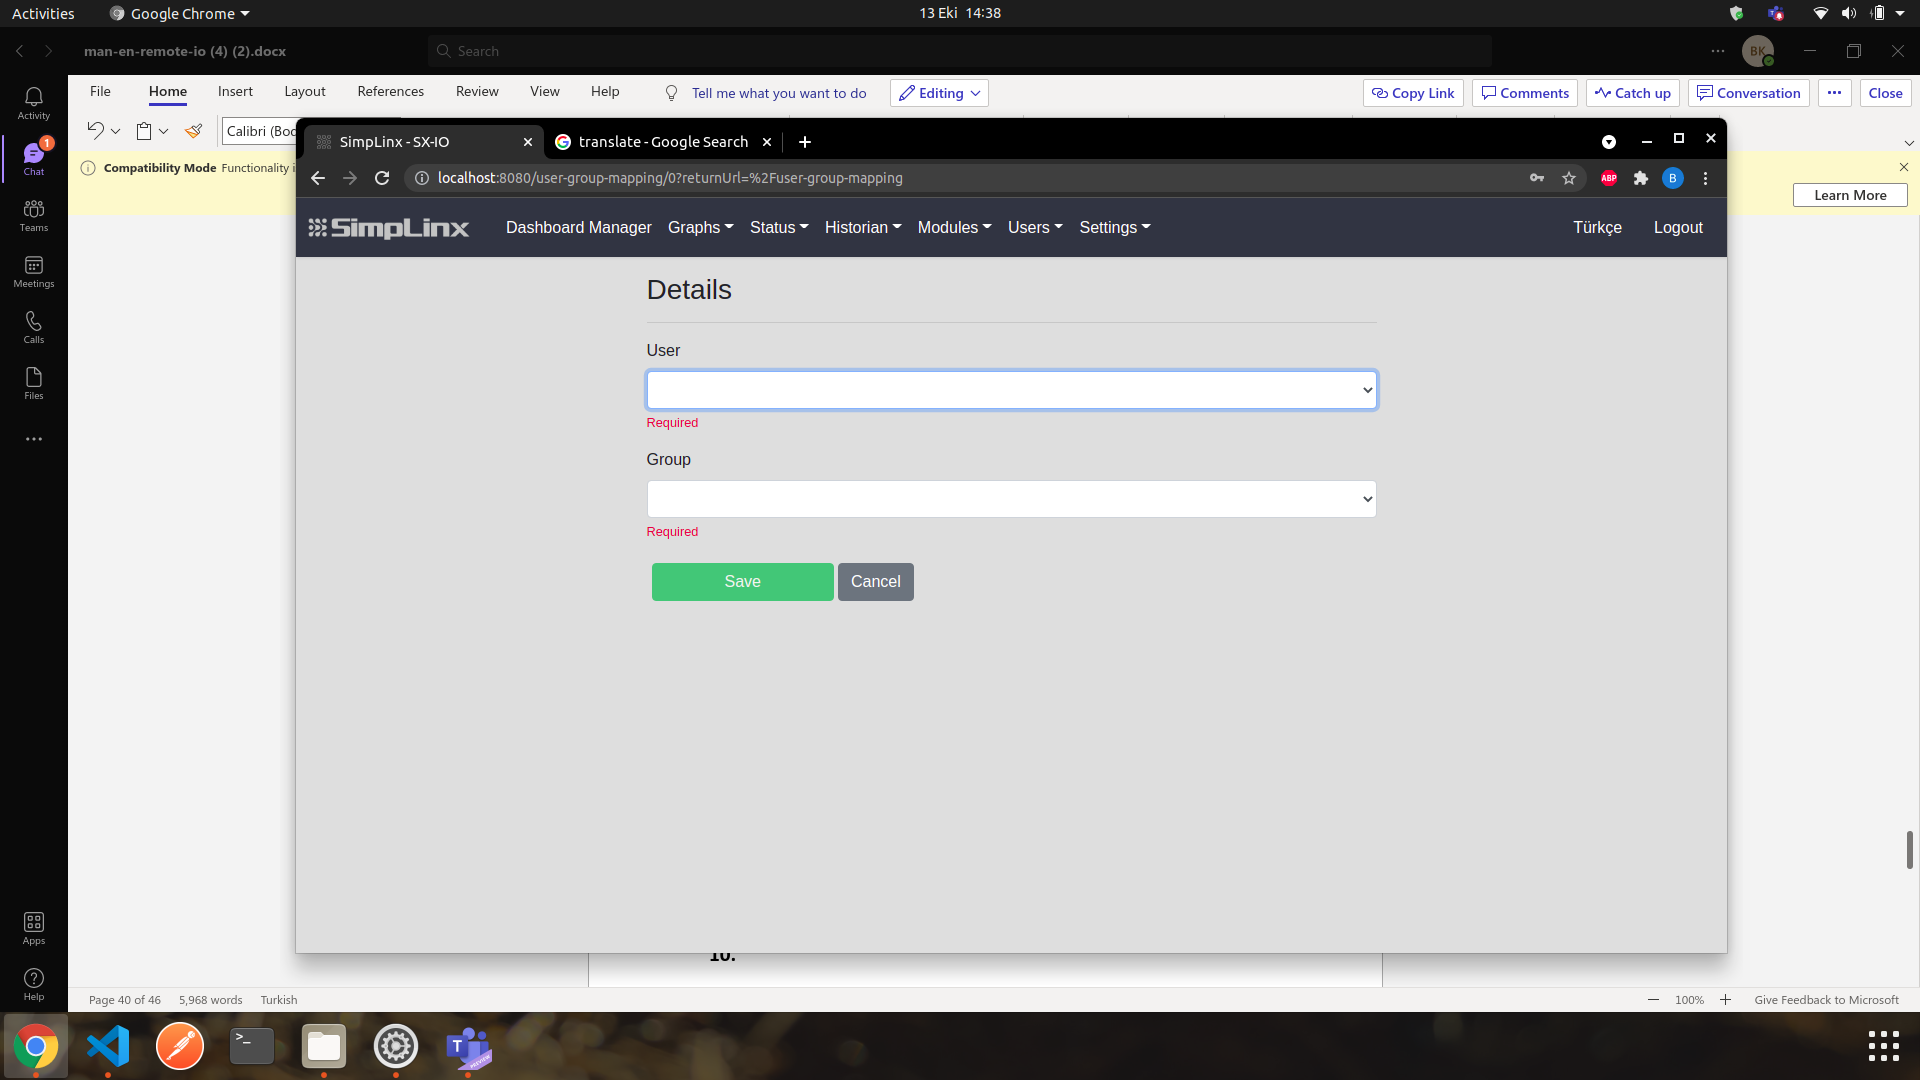
Press the icon from Toolbar to +, you will be redirected to the “Details” page. The required information on this page is as follows;
User: The area where the user can be selected for group.
Group: The area where the group can be selected for specific user.
Settings Page
Section titled “Settings Page”This tab contains pages that are accessible only to the admin user and where systemic settings are made. These are;
User Profile
Section titled “User Profile”System Info
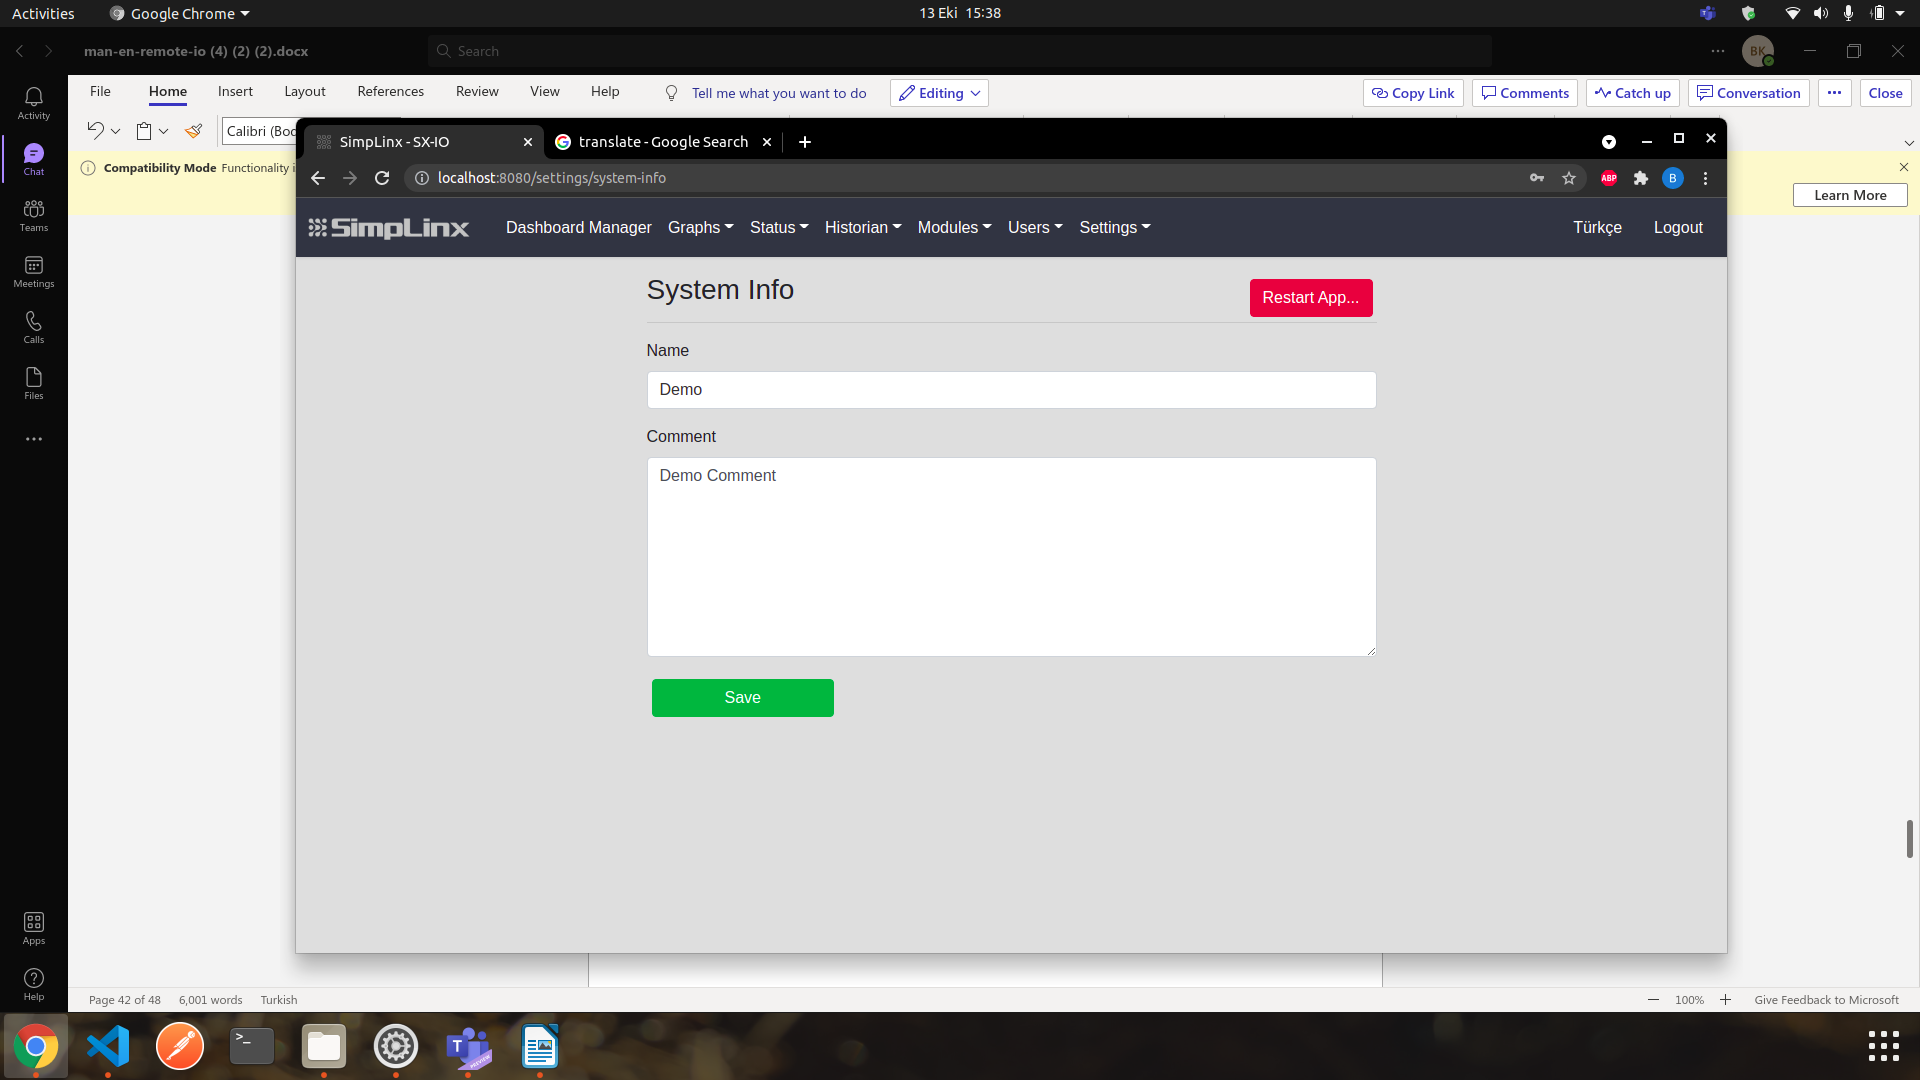
Section titled “System Info”On this page, you can define your system information or, if necessary, restart SX-IO with the Restart App… button.
 Defining system information helps you to recognize which system and device the e-mail comes from in the emails sent depending on the event. It is necessary to specify a system name, but you can leave the comment section blank if you wish.
License
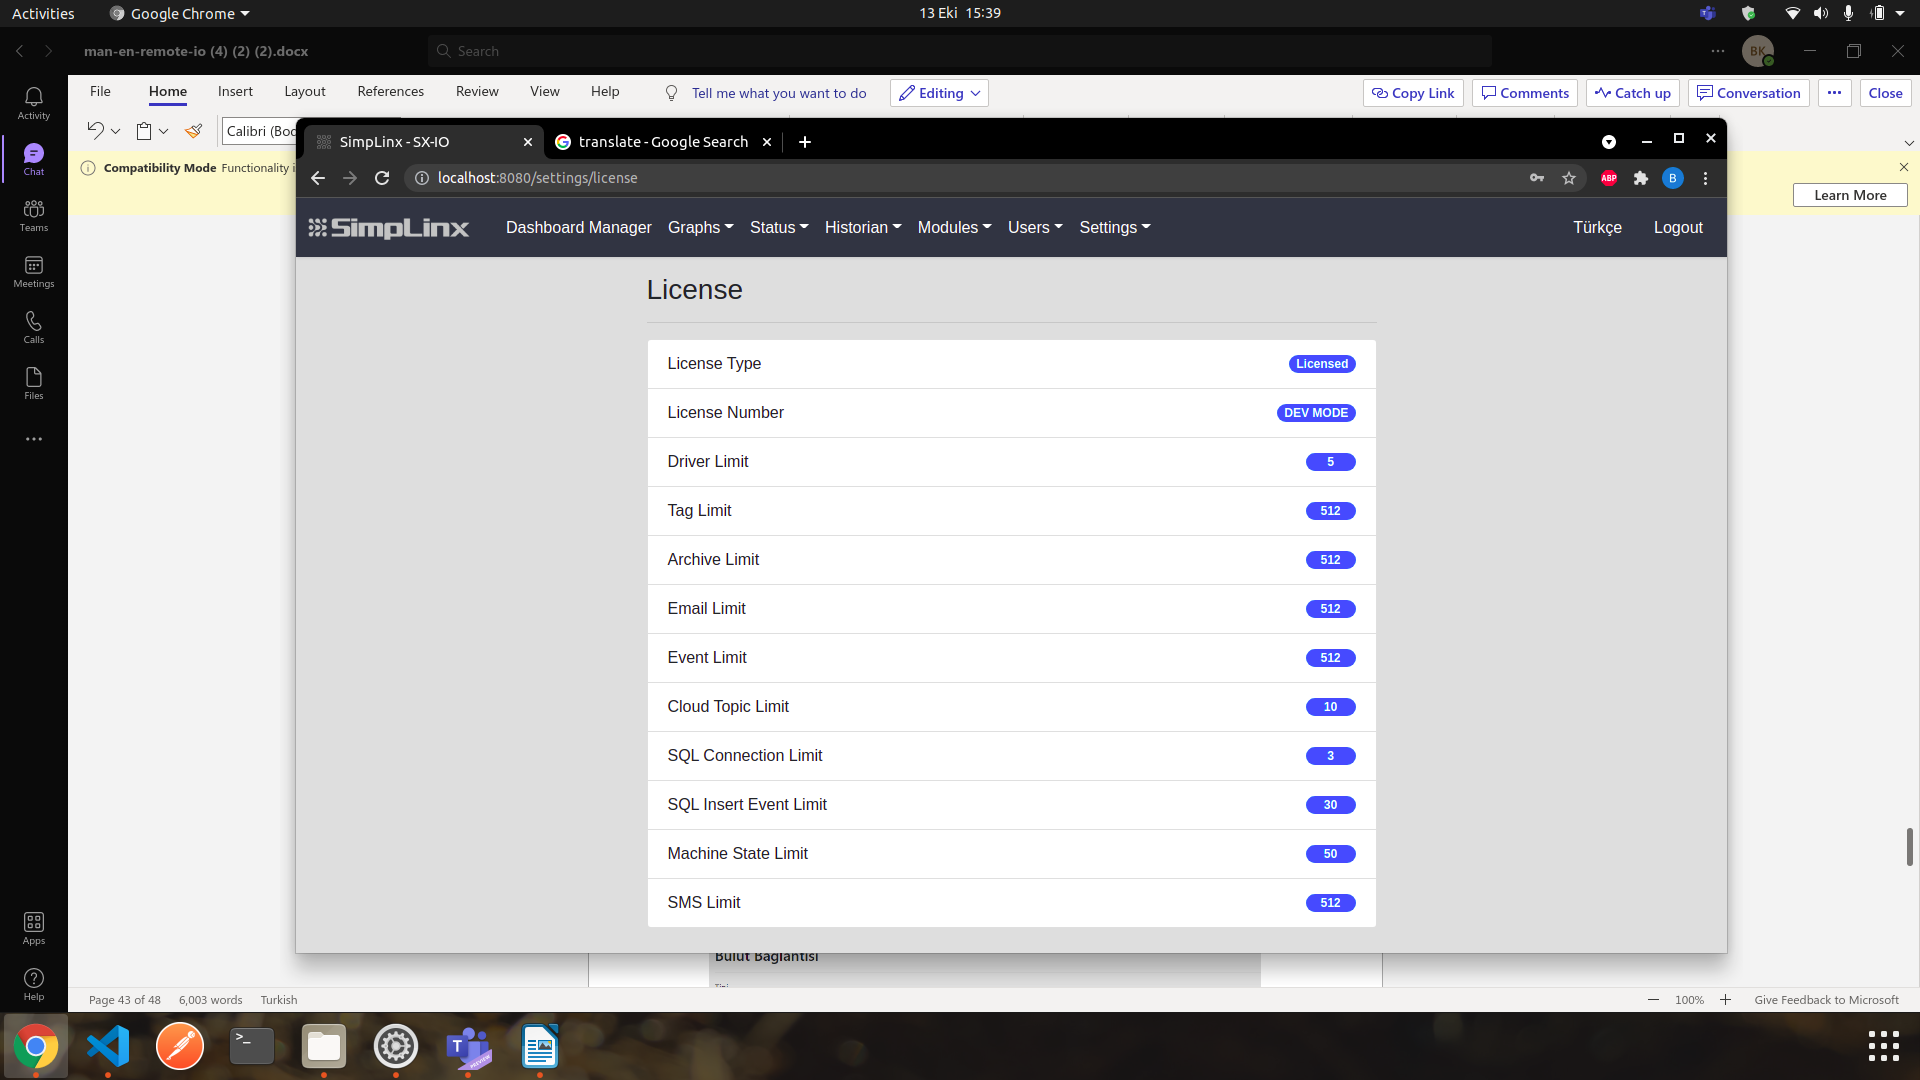
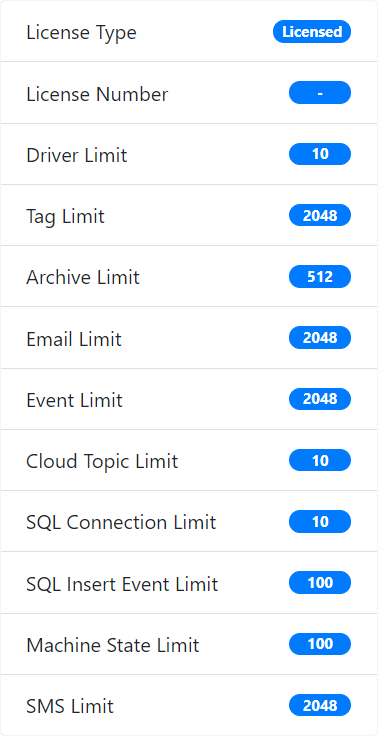
Section titled “License”On this page, you can see your license details and limit records for modules.
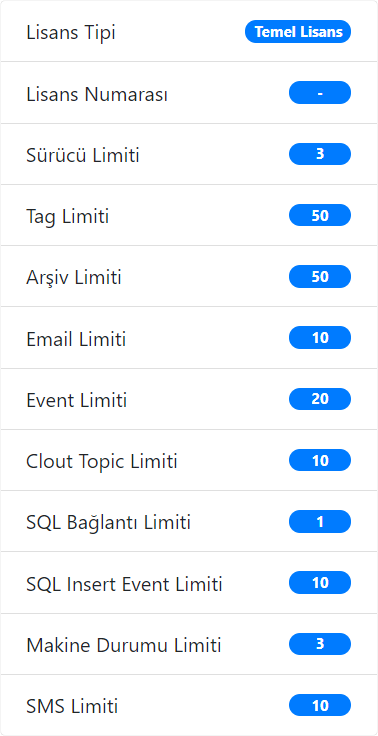
There are 4 different license types. These;
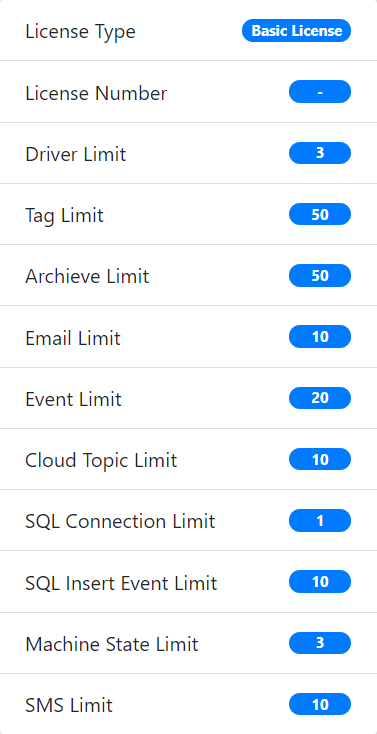 | 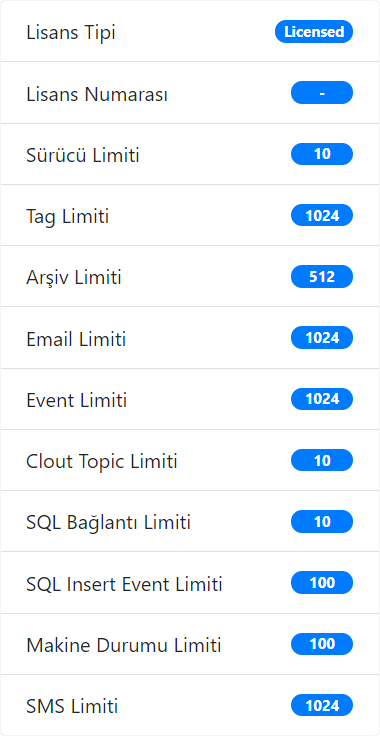 |
|---|---|
| Basic License | 512 Tag |
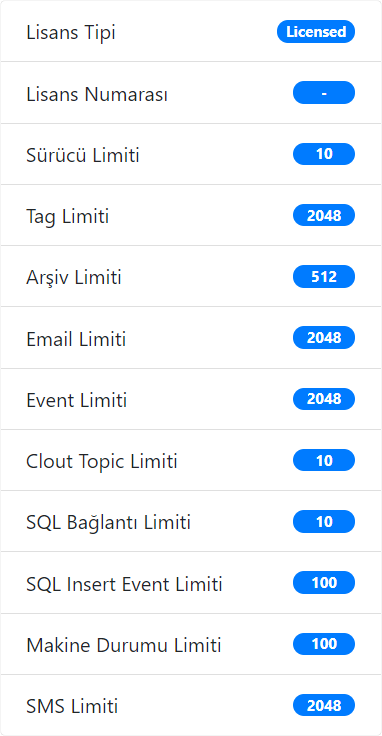 |  |
| 1024 Tag | 2048 Tag |
Cloud Connector
Section titled “Cloud Connector”On this page, you can easily set up with information from your cloud service provider if you want to save your data on a cloud system instead of saving it to device memory. For now, only 3 service providers are supported. These are;
-
Google (MQTT)
-
Amazon (AWS)
-
Microsoft (Azure)
-
DIGITERYA ARYA
Once the relevant option is selected, you can provide a connection and save your data to the cloud server by filling in the information provided by your service provider where necessary. More information can be found at the bottom of the page with Click Here for Information.
SMS Connector
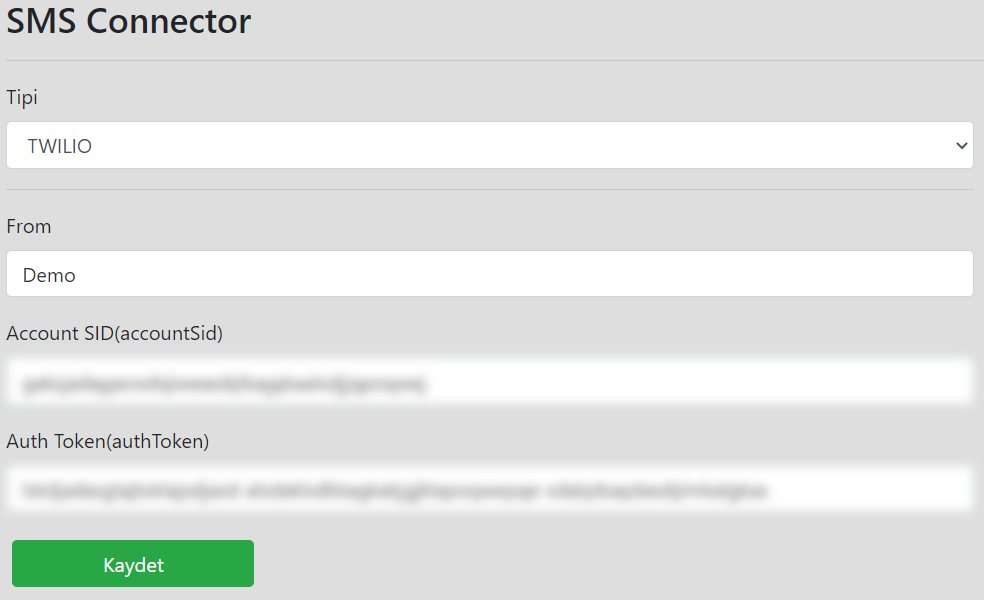
Section titled “SMS Connector”If you want to be notified by SMS depending on the events you have created, you can easily install with the information you receive from your SMS service provider. For now, only TWILIO is supported.
After the relevant option is selected, you can provide a connection by filling in the sender name then the information provided by your service provider where necessary, and receive SMS notifications, depending on the events you have already set.
SQL Connector
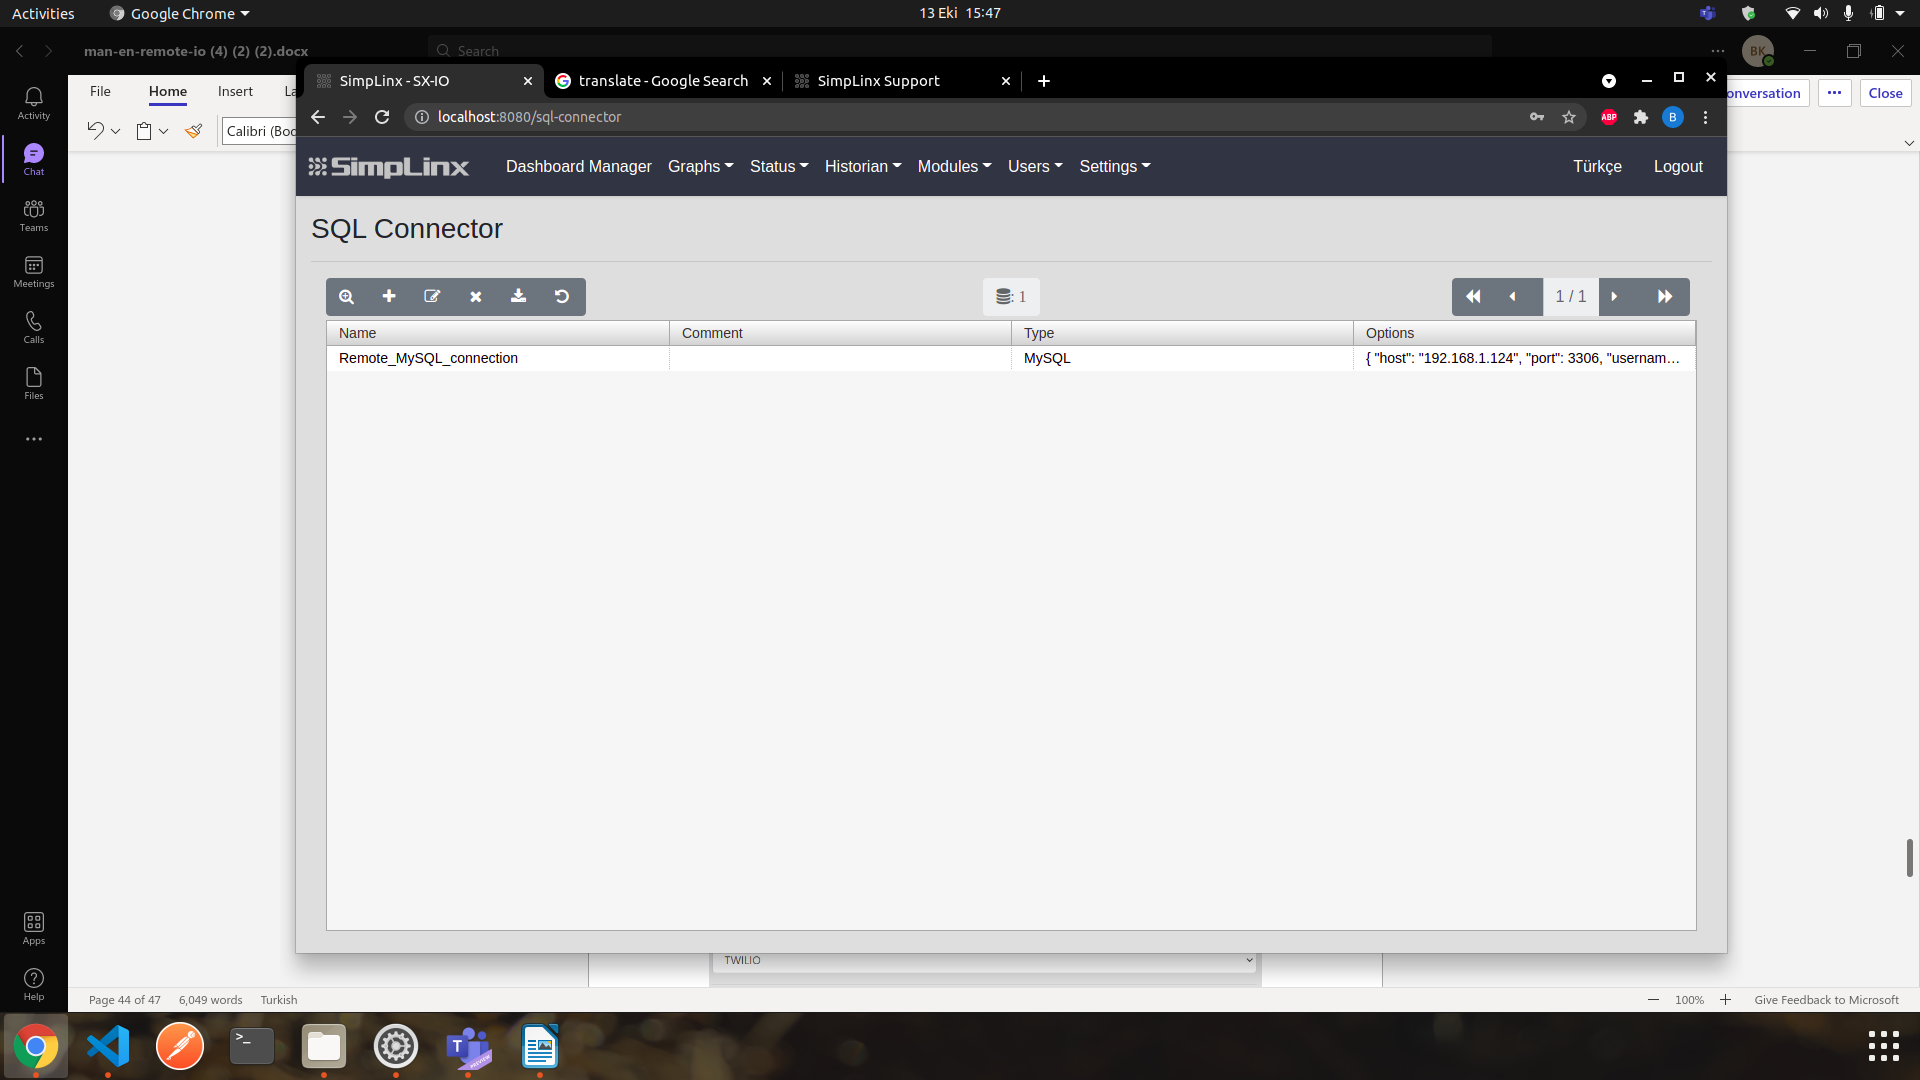
Section titled “SQL Connector”On this page, you can connect remote database, view the information about remote databases and update current remote database information. 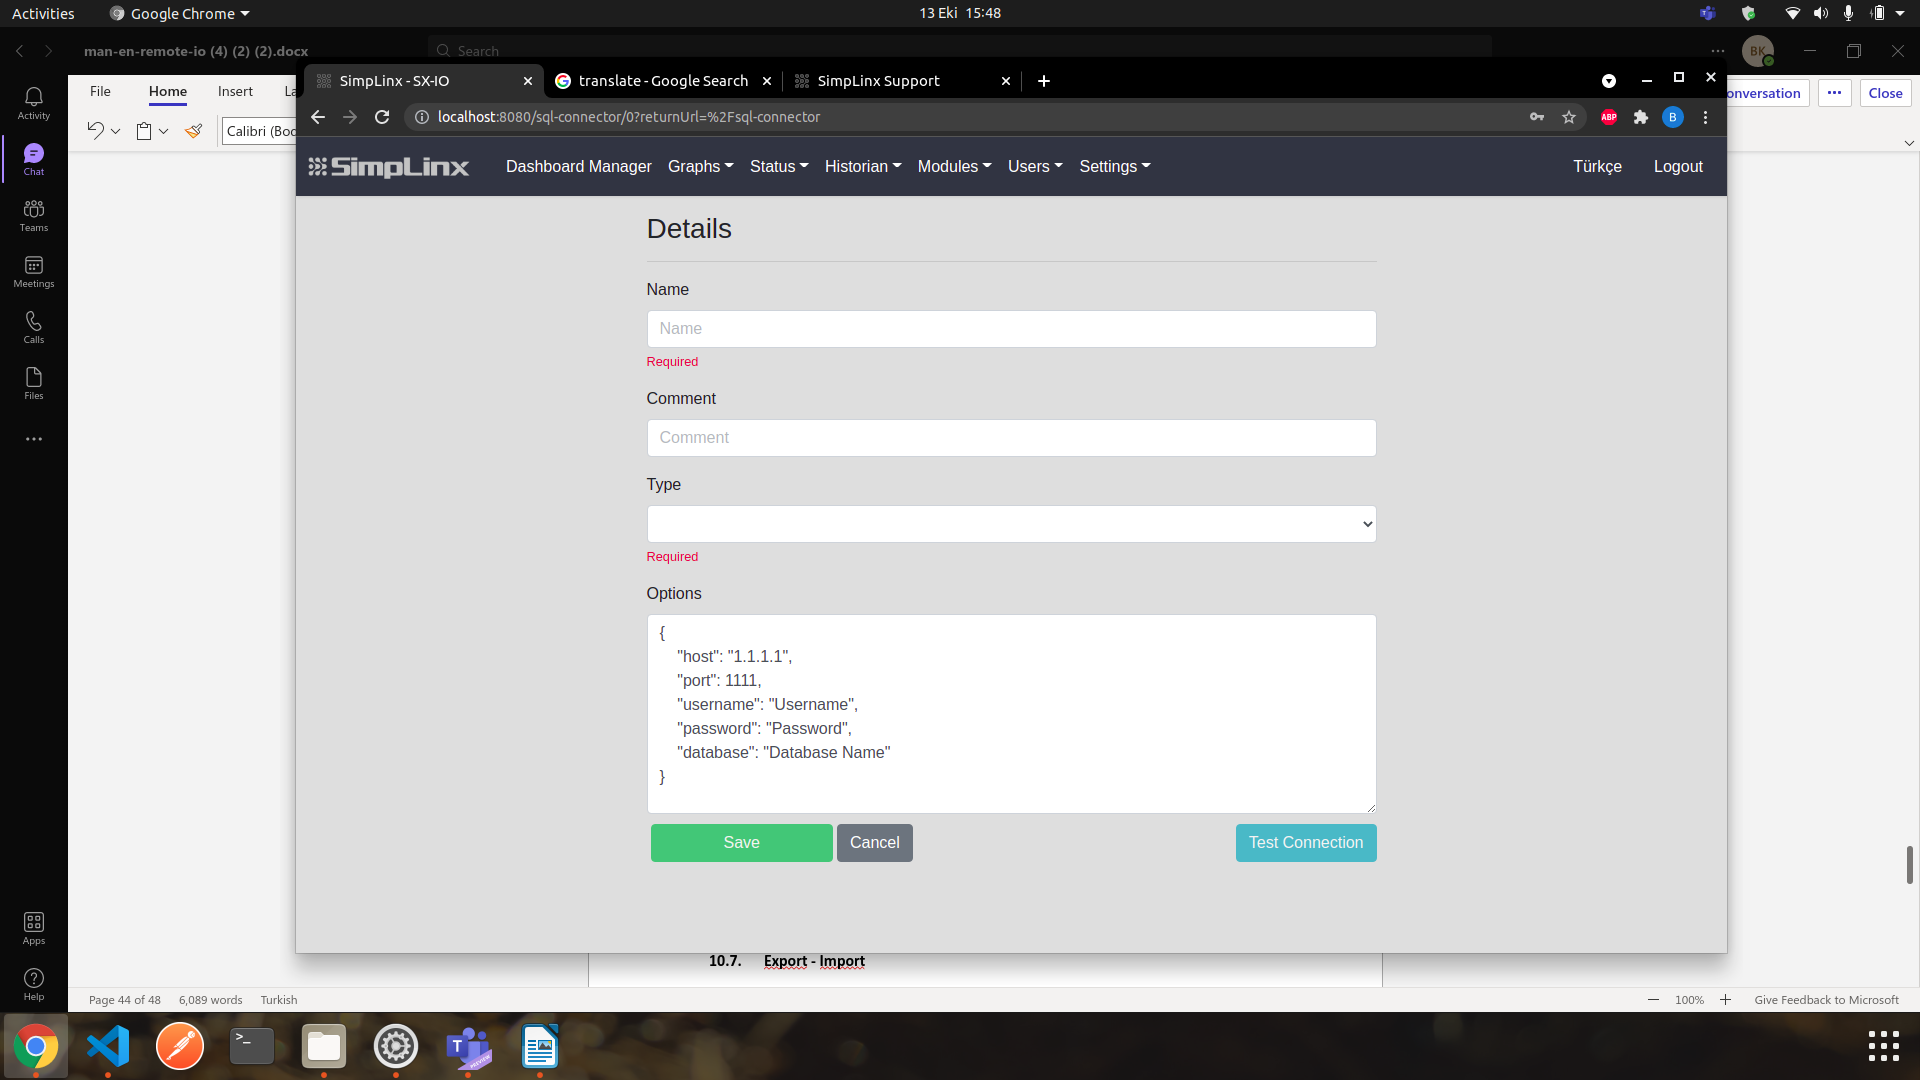
Adding New SQL Connection:
-
From the Menu, go to the “Settings”--->“SQL Connector” page.
-
Press the icon from Toolbar to +, you will be redirected to the “Details” page. The required information on this page is as follows;
-
On the “Details” page, there is a button which is “Test Connection” to test remote database connection. If connection successful, there will be green pop up message on the left corner with “Connection is successful” message.
Name: The area where the name is determined for SQL connection.
Comment: A comment can be added to provide information about the SQL Connector created. It is not mandatory, it can be left blank.
Type: Choose proper type for remote database connection. There are 3 types: Postgresql, MySQL, MS_SQL
Options: Set your database connection options in curly braces
Export – Import
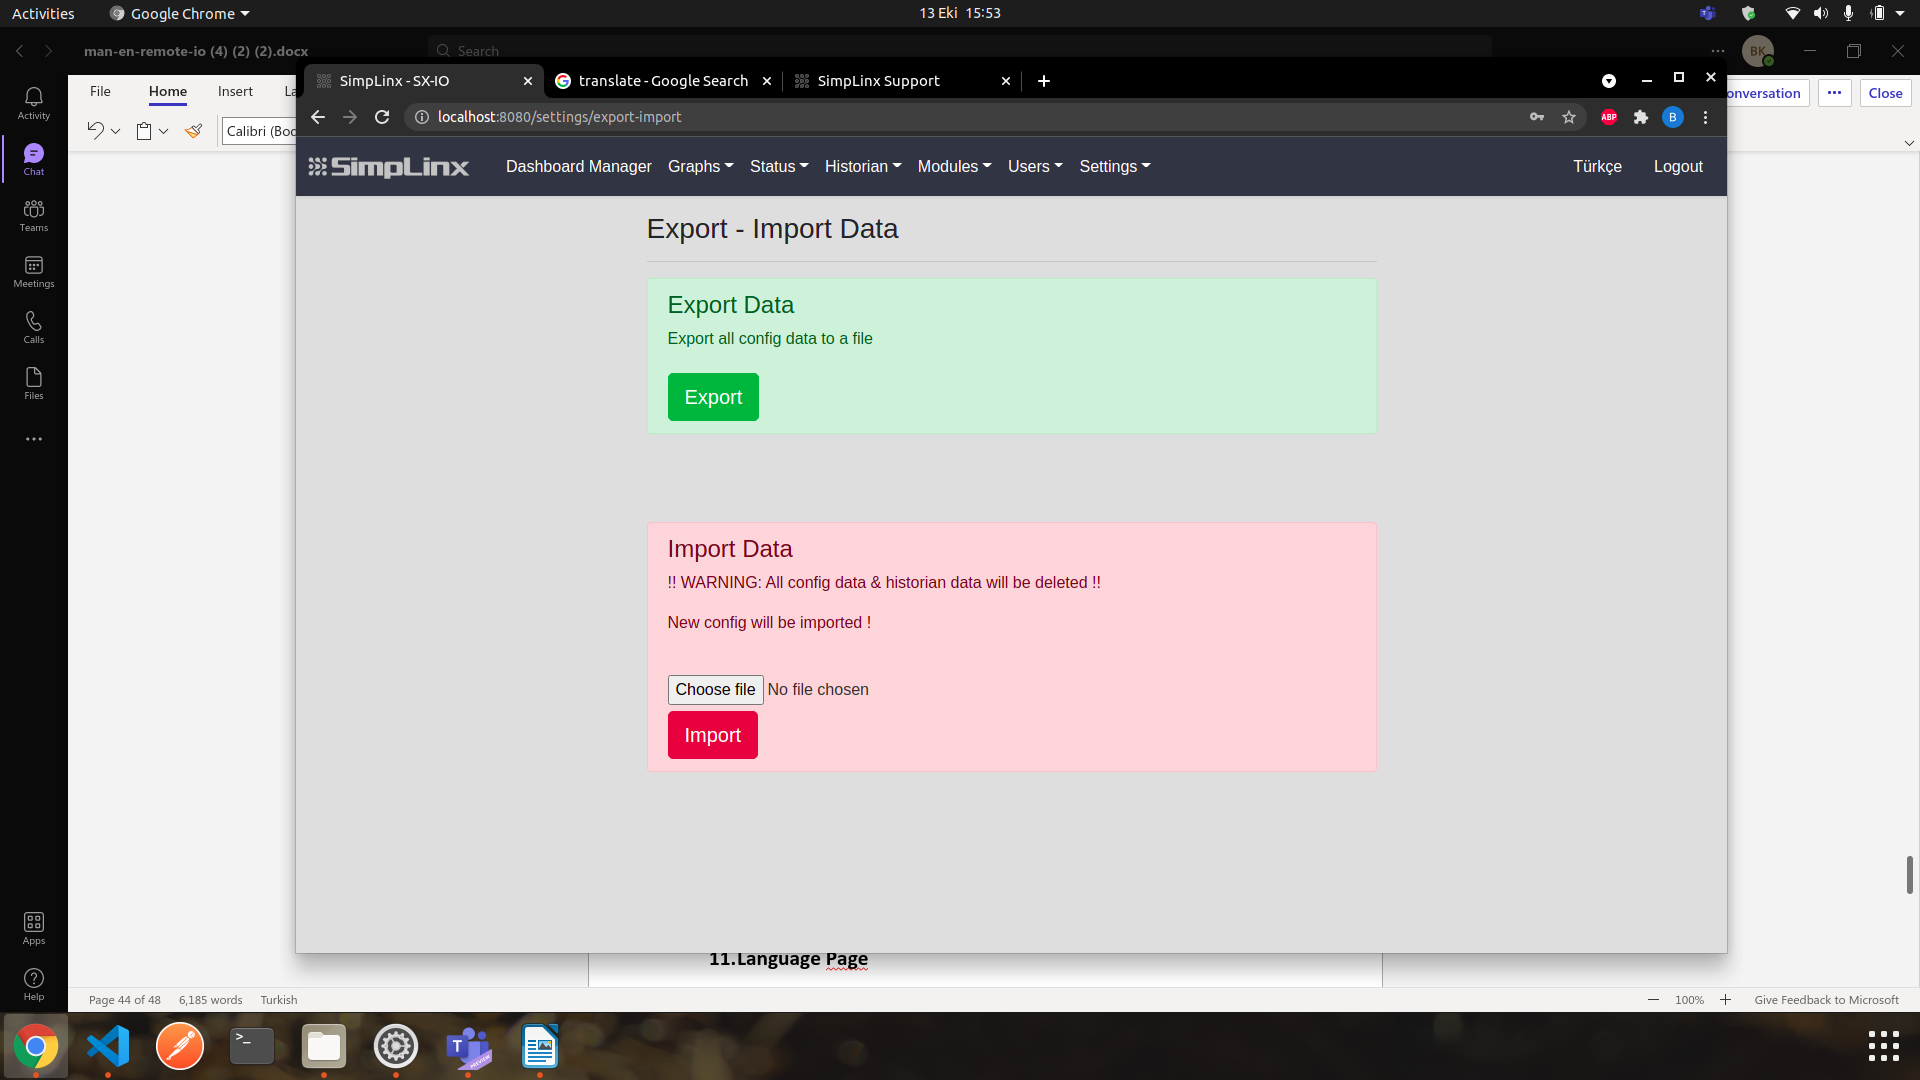
Section titled “Export – Import”This page is used to easily transfer all the settings you have made on the interface to another device. Once you’ve set your settings to a standard, you can easily download them as files with the Export button and then easily set it with the Import button after selecting the relevant file from the new device, instead of adjusting the same settings on all individual devices.
 | After importing, all data (Configuration and Historian) will be deleted and the new configuration will be imported. This process cannot be reversed! |
|---|
Customize View
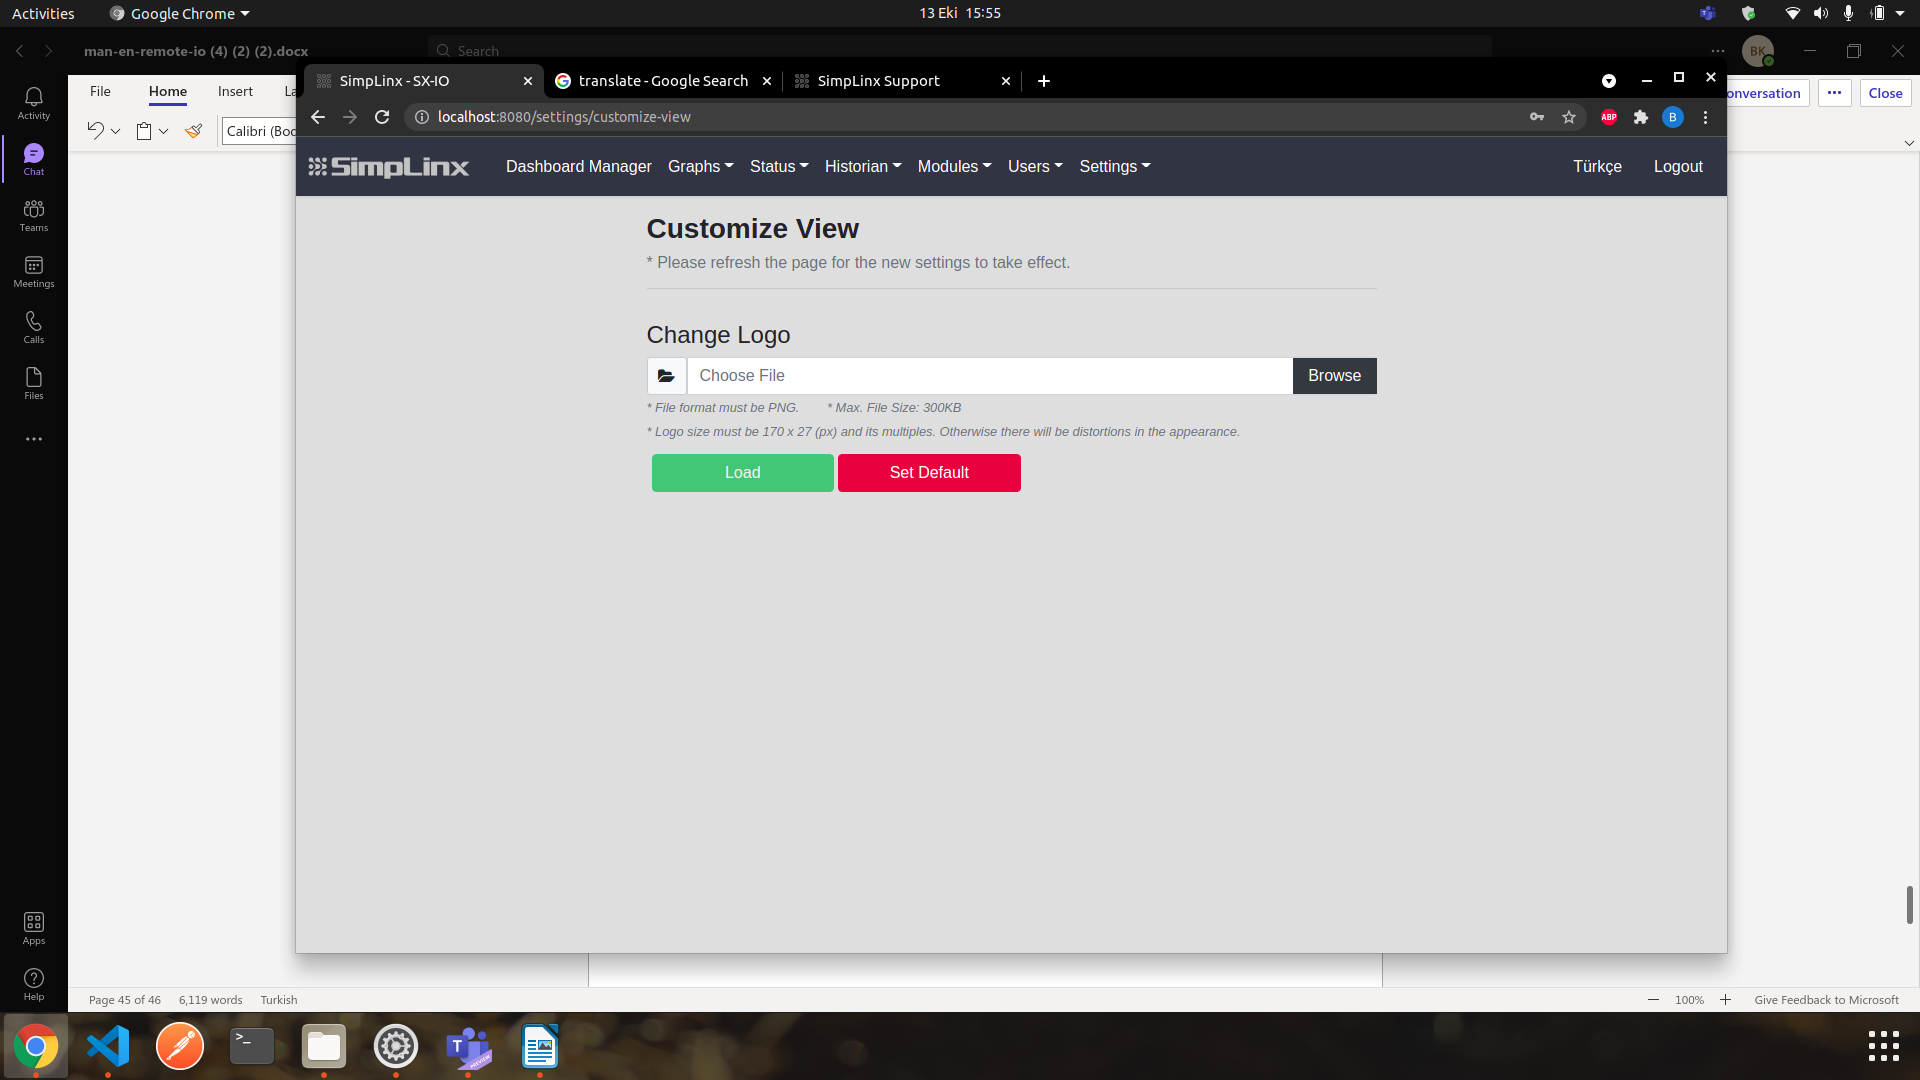
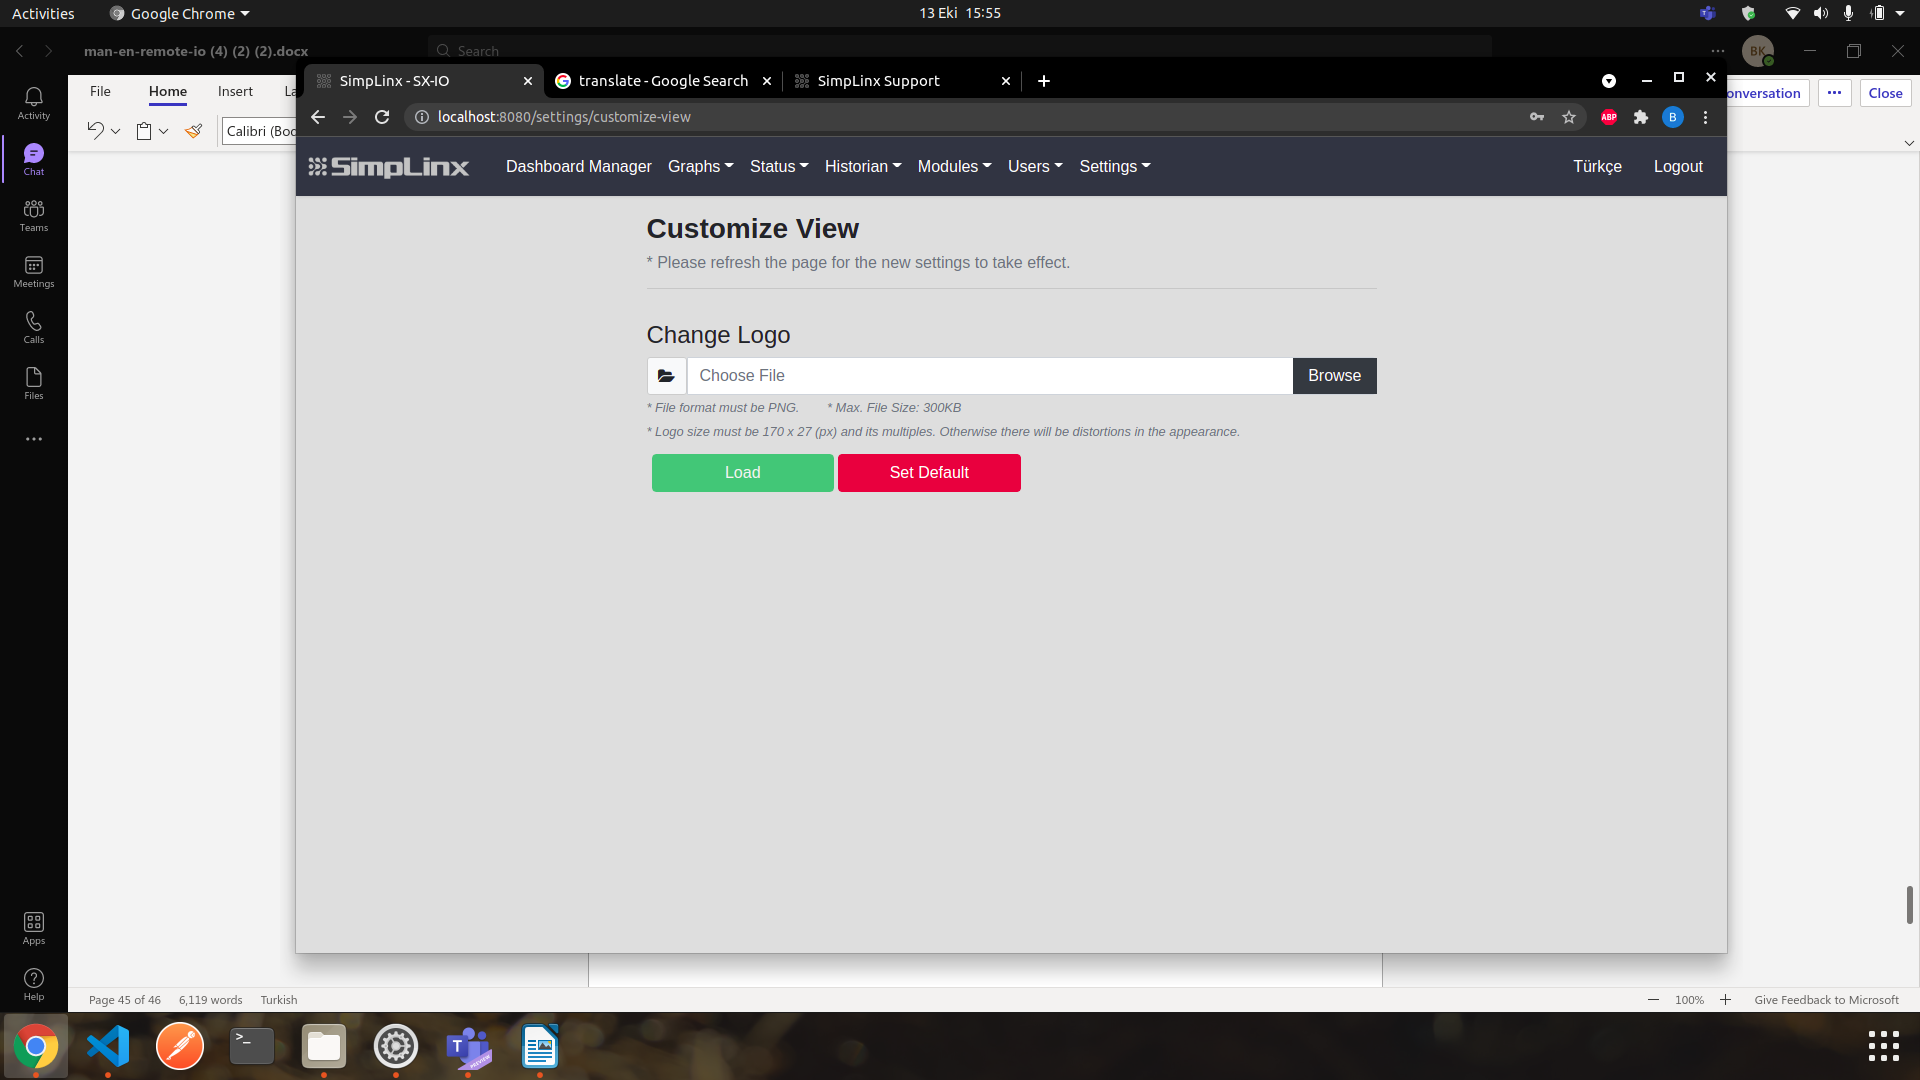
Section titled “Customize View”This page is used to cuztomize view for SX-IO. You can change logo on this page. To do that, choose proper file for logo and then click “Load” button. To set default logo, click “Set Default” button.
10/2021 man-en-sx-io.docx Version 2.0 |
SimpLinx Elektronik Ltd. Halil Rifat Pasa Mh. Nazli Sk. No:1/5 No:17 Sisli/Istanbul www.simplinx.com |
|---|
Change Log
Section titled “Change Log”| Version | Date | Description |
|---|---|---|
| V1.0 | 07/2020 | |
| V2.0 | 10/2021 |
Legal Notices
Section titled “Legal Notices”Warning Notice System
Section titled “Warning Notice System”This document contains alerts and information indications for the safety of you and your devices. The symbols and meanings used to draw your attention to these notifications are listed below.
Qualified Personnel
Section titled “Qualified Personnel”It is assumed that what is described in this document will be applied by qualified personnel for the specific task.
Disclaimer
Section titled “Disclaimer”We have reviewed the contents of this publication to ensure consistency with the hardware and software described. Since variance cannot be precluded entirely, we cannot guarantee full consistency. The information in this publication is reviewed regularly and any necessary corrections are included in subsequent editions.